

Table of Contents
When you think about where to move, hear about a transfer, or estimate the cost of living after relocating to a regional town, figures for pay and rent are easy to find. What is surprisingly hard to compare is whether prices in a place are high or low overall. Comparing price tags at the supermarket only tells you about a few items.
Every year, the Statistics Bureau of Japan publishes the Regional Difference Index of Consumer Prices. It sets the national price level at 100 and expresses each prefecture’s price level as a single number. The latest results are for 2025 and were published on 18 September 2026[1][3].
In this article I ranked the 47 prefectures with this index and looked at where the differences arise, category by category: food, housing, utilities and so on. Besides the ranking with rent excluded and the change from the previous year, I also adjusted average pay by prefecture and the minimum wage for price levels.
1. Key findings: prices are highest in Tokyo (104.2) and lowest in Gunma (96.2), a gap of only 1.08 times
- In 2025 Tokyo had the highest overall price level, at 104.2. Kanagawa was second (103.3), Hokkaido third (102.4), Kyoto fourth (101.1) and Chiba fifth (100.5)[1].
- Gunma was lowest at 96.2, followed by Kagoshima (96.4), Nagano (96.9), Gifu (97.2) and Tochigi (97.3).
- The gap between the highest, Tokyo, and the lowest, Gunma, is 1.08 times. Ten prefectures are at or above the national average of 100 and 37 are below it, with 30 falling in the narrow band from 98 to 102.
- With rent excluded, Hokkaido comes first (103.2). Tokyo drops to third at 102.2, Saitama falls from 7th to 15th and Osaka from 11th to 18th.
- The biggest gaps are in housing and education. For housing, Tokyo (129.8) is 1.64 times Okayama (79.1); for education, Osaka (124.7) is 1.60 times Toyama (78.1). By contrast, the gap is only 1.12 times for food and 1.06 times for transport and communication[1].
- Adjusting for prices narrows regional gaps but does not remove them. The gap in estimated annual pay shrinks from 1.69 to 1.59 times, and the gap in FY2026 minimum wages from ¥195 to ¥156. On a price-adjusted basis, Kanagawa’s minimum wage overtakes Tokyo’s for first place.
What is the Regional Difference Index of Consumer Prices?
The index combines the prices of the many goods and services households buy and expresses the difference in overall price levels between regions. The national average is 100, and the index is compiled every year for regions, prefectures, prefectural capitals and designated cities[4].
- It is built from the Retail Price Survey. It uses prices from the monthly “trend” survey and from the “structural” survey, which widens coverage to measure regional differences. The structural survey covers 89 cities not included in the trend survey’s 167 municipalities and collects prices for 57 items in odd-numbered months. It records normal prices, not sale prices that last seven days or less[1].
- It covers 588 items. These are the items in the consumer price index (CPI) except imputed rent for owner-occupied housing (the rent owner-occupiers would pay if they rented their own home)[4].
- Price differences for each item are combined using spending weights. The weights come from the past five years of the Family Income and Expenditure Survey (households of two or more people). An index averaged with national weights and one averaged with regional weights are combined (a Fisher-type formula)[4].
- “All items” and “housing” exclude imputed rent for owner-occupied housing. “All items less rent” further removes private rents and rents for public, Urban Renaissance Agency and housing corporation housing[5].
In effect, the index asks: if the average household’s shopping basket for the whole country were bought again at each area’s prices, how much would it cost? Because it compares the prices of the same items, differences in how much people buy in each area (more heating, more driving and so on) are not reflected to the extent they affect living costs. Section 8 covers this in more detail.
2. Ranking of all 47 prefectures: 10 at or above 100, and 30 clustered between 98 and 102
| Rank | Prefecture | All items | All items less rent (rank) | Housing | 2024 (rank) | Change |
|---|---|---|---|---|---|---|
| 1 | Tokyo | 104.2 | 102.2 (3rd) | 129.8 | 104.0 (1st) | +0.2 |
| 2 | Kanagawa | 103.3 | 102.7 (2nd) | 110.7 | 103.3 (2nd) | ±0.0 |
| 3 | Hokkaido | 102.4 | 103.2 (1st) | 92.6 | 101.9 (3rd) | +0.5 |
| 4 | Kyoto | 101.1 | 101.0 (5th) | 102.2 | 101.1 (6th) | ±0.0 |
| 5 | Chiba | 100.5 | 100.4 (9th) | 111.8 | 101.2 (5th) | -0.7 |
| 6 | Okinawa | 100.4 | 101.3 (4th) | 95.4 | 100.2 (9th) | +0.2 |
| 7 | Miyagi | 100.2 | 100.4 (9th) | 96.4 | 100.6 (7th) | -0.4 |
| 7 | Saitama | 100.2 | 100.0 (15th) | 104.5 | 100.3 (8th) | -0.1 |
| 9 | Yamagata | 100.1 | 100.9 (6th) | 93.5 | 101.4 (4th) | -1.3 |
| 10 | Iwate | 100.0 | 100.4 (9th) | 97.5 | 100.0 (10th) | ±0.0 |
| 11 | Kochi | 99.9 | 100.8 (7th) | 94.8 | 100.0 (10th) | -0.1 |
| 11 | Osaka | 99.9 | 99.8 (18th) | 98.0 | 99.3 (16th) | +0.6 |
| 13 | Kumamoto | 99.8 | 100.8 (7th) | 95.1 | 99.4 (15th) | +0.4 |
| 13 | Shimane | 99.8 | 100.4 (9th) | 89.0 | 100.0 (10th) | -0.2 |
| 15 | Yamaguchi | 99.6 | 100.2 (13th) | 95.3 | 99.9 (13th) | -0.3 |
| 15 | Nagasaki | 99.6 | 100.0 (15th) | 95.1 | 99.3 (16th) | +0.3 |
| 17 | Ishikawa | 99.4 | 100.1 (14th) | 82.0 | 99.5 (14th) | -0.1 |
| 17 | Hyogo | 99.4 | 99.6 (20th) | 92.7 | 99.2 (20th) | +0.2 |
| 19 | Fukui | 99.3 | 99.6 (20th) | 87.3 | 99.3 (16th) | ±0.0 |
| 20 | Ehime | 99.2 | 100.0 (15th) | 86.5 | 98.6 (26th) | +0.6 |
| 21 | Tottori | 99.1 | 99.8 (18th) | 85.8 | 98.9 (22nd) | +0.2 |
| 22 | Fukushima | 99.0 | 99.6 (20th) | 93.3 | 98.8 (23rd) | +0.2 |
| 23 | Tokushima | 98.9 | 99.6 (20th) | 90.7 | 99.3 (16th) | -0.4 |
| 24 | Hiroshima | 98.8 | 99.4 (25th) | 88.5 | 98.7 (24th) | +0.1 |
| 25 | Kagawa | 98.7 | 99.4 (25th) | 85.1 | 98.6 (26th) | +0.1 |
| 25 | Toyama | 98.7 | 99.0 (29th) | 93.8 | 98.6 (26th) | +0.1 |
| 27 | Akita | 98.6 | 99.1 (27th) | 87.5 | 99.2 (20th) | -0.6 |
| 28 | Saga | 98.5 | 99.6 (20th) | 90.2 | 97.7 (38th) | +0.8 |
| 28 | Fukuoka | 98.5 | 99.1 (27th) | 96.4 | 98.0 (35th) | +0.5 |
| 30 | Shizuoka | 98.2 | 98.7 (32nd) | 92.5 | 98.3 (31st) | -0.1 |
| 31 | Mie | 98.1 | 98.6 (33rd) | 88.9 | 98.7 (24th) | -0.6 |
| 32 | Miyazaki | 98.0 | 98.9 (30th) | 101.3 | 97.0 (45th) | +1.0 |
| 32 | Aichi | 98.0 | 98.4 (37th) | 94.6 | 98.1 (33rd) | -0.1 |
| 34 | Aomori | 97.9 | 98.8 (31st) | 94.2 | 98.5 (30th) | -0.6 |
| 35 | Nara | 97.8 | 98.5 (35th) | 91.5 | 98.1 (33rd) | -0.3 |
| 35 | Niigata | 97.8 | 98.0 (41st) | 83.8 | 98.0 (35th) | -0.2 |
| 37 | Wakayama | 97.7 | 98.5 (35th) | 87.4 | 98.2 (32nd) | -0.5 |
| 37 | Yamanashi | 97.7 | 98.3 (38th) | 94.5 | 97.7 (38th) | ±0.0 |
| 37 | Okayama | 97.7 | 98.3 (38th) | 79.1 | 97.7 (38th) | ±0.0 |
| 37 | Shiga | 97.7 | 98.2 (40th) | 83.3 | 98.6 (26th) | -0.9 |
| 41 | Ibaraki | 97.5 | 98.0 (41st) | 95.7 | 97.5 (42nd) | ±0.0 |
| 42 | Oita | 97.4 | 98.6 (33rd) | 85.4 | 97.4 (43rd) | ±0.0 |
| 43 | Tochigi | 97.3 | 97.6 (44th) | 86.4 | 97.6 (41st) | -0.3 |
| 44 | Gifu | 97.2 | 97.7 (43rd) | 83.4 | 97.1 (44th) | +0.1 |
| 45 | Nagano | 96.9 | 97.5 (45th) | 89.4 | 97.9 (37th) | -1.0 |
| 46 | Kagoshima | 96.4 | 96.9 (46th) | 91.1 | 96.4 (46th) | ±0.0 |
| 47 | Gunma | 96.2 | 96.7 (47th) | 89.5 | 96.2 (47th) | ±0.0 |
National average = 100. The 2025 values and ranks are from the e-Stat table and appendix table 1 of the summary of results, and 2024 from the previous year’s results. As in the bureau’s releases, equal values share a rank[6][8][2].
The top is the Tokyo area plus Hokkaido and Kyoto, and Tokyo has been first for 13 years running
Tokyo has been first every year for 13 years, since the structural survey began in 2013[1]. The four Tokyo-area prefectures of Tokyo, Kanagawa, Chiba and Saitama are all in the top eight, joined by Hokkaido (3rd), Kyoto (4th), Okinawa (6th) and Miyagi (7th).
What matters most when reading the ranking is how small the differences are. Only four prefectures, Tokyo, Kanagawa, Hokkaido and Kyoto, are more than 1 point above the national average, and everything from Osaka in 11th (99.9) to Shizuoka in 30th (98.2) is packed into a band of 1.7 points. Since a difference in the first decimal place can swap ranks, the index value tells you more than the rank does.
The highest-to-lowest gap has stayed between 1.08 and 1.10 times for 13 years
The ratio of the highest prefecture to the lowest was 1.08 times in 2025, the same as in 2024[1]. Looking back to 2013, the ratio has only moved between 1.08 and 1.10 times.
| Year | Highest | Lowest | Ratio | Prefectures at or above 100 |
|---|---|---|---|---|
| 2013 | 105.2 (Tokyo) | 96.1 (Miyazaki) | 1.09 | 8 |
| 2016 | 104.4 (Tokyo) | 95.9 (Gunma) | 1.09 | 11 |
| 2020 | 105.2 (Tokyo) | 95.9 (Miyazaki) | 1.10 | 8 |
| 2023 | 104.5 (Tokyo) | 95.9 (Kagoshima) | 1.09 | 9 |
| 2024 | 104.0 (Tokyo) | 96.2 (Gunma) | 1.08 | 12 |
| 2025 | 104.2 (Tokyo) | 96.2 (Gunma) | 1.08 | 10 |
Estimated annual pay differs by 1.69 times between Tokyo and Aomori (see below). Both are “regional gaps”, but the gap in prices is much smaller than the gap in pay.
3. Excluding rent puts Hokkaido first: Tokyo drops to third and Saitama from 7th to 15th
The overall ranking includes differences in rent. Re-ranked by “all items less rent”, the top and bottom look like this[1][6].
- Top: Hokkaido (103.2), Kanagawa (102.7), Tokyo (102.2), Okinawa (101.3), Kyoto (101.0)
- Bottom: Gunma (96.7), Kagoshima (96.9), Nagano (97.5), Tochigi (97.6), Gifu (97.7)
The highest-to-lowest gap becomes 1.07 times, even smaller than the 1.08 for all items. The lead switches from Tokyo to Hokkaido because a large part of Tokyo’s high prices comes from rent.
Prefectures whose rank moves a lot when rent is excluded
These prefectures move five or more places between the all-items and the less-rent rankings.
| Prefecture | All-items rank | Less-rent rank | Move |
|---|---|---|---|
| Saitama | 7th | 15th | down 8 |
| Osaka | 11th | 18th | down 7 |
| Niigata | 35th | 41st | down 6 |
| Aichi | 32nd | 37th | down 5 |
| Oita | 42nd | 33rd | up 9 |
| Saga | 28th | 20th | up 8 |
| Kumamoto | 13th | 7th | up 6 |
| Ehime | 20th | 15th | up 5 |
Saitama has the fourth-highest housing index in Japan at 104.5, and once rent is excluded it sits exactly at the national average (100.0). Oita, Saga and Kumamoto, on the other hand, have low housing prices, but goods and services other than rent are not as cheap as their all-items figures suggest. Kumamoto’s all-items-less-rent index is 100.8, above the national average.
Rent takes the largest share of household spending in Okinawa and Tokyo
How much rent matters depends not only on how high it is but on how much weight it carries in local household budgets. The bureau also publishes the weights used to calculate the index[7]. Working out rent’s share of spending from the difference between the all-items and the less-rent weights gives 3.1% nationally.
- High: Okinawa 6.6%, Tokyo 5.3%, Hokkaido 4.0%, Osaka 4.0%, Kanagawa 3.8%
- Low: Toyama 1.1%, Mie 1.1%, Gifu 1.2%, Niigata 1.3%, Yamagata 1.5%
A national figure of 3.1% may look surprisingly small. The weights are based on the budgets of all households of two or more people, including homeowners, and since homeowners pay no rent, the average share is diluted. For households that do rent, rent weighs far more. As calculated in Rent by Prefecture in Japan, private rents average ¥65,496 a month nationally and ¥100,530 in Tokyo’s 23 wards[11]. For people who rent, the housing index is probably closer to their experience than the all-items index.
4. By category, the gaps are widest for housing and education and narrow for food and transport
The all-items index combines ten major categories. For each one, here are the highest and lowest prefectures[1].
| Category | Share of spending (national) | Highest | Lowest | Ratio (2025) | Ratio (2024) |
|---|---|---|---|---|---|
| Food | 31.7% | Okinawa 106.6 | Nagano 95.0 | 1.12 | 1.11 |
| Housing | 7.2% | Tokyo 129.8 | Okayama 79.1 | 1.64 | 1.56 |
| Fuel, light and water | 8.3% | Hokkaido 117.8 | Osaka 90.6 | 1.30 | 1.37 |
| Furniture and household utensils | 4.6% | Ehime 104.7 | Ibaraki 92.3 | 1.13 | 1.12 |
| Clothing and footwear | 3.7% | Hokkaido and Ishikawa 107.3 | Kagoshima 88.7 | 1.21 | 1.25 |
| Medical care | 5.7% | Tokyo and Yamaguchi 101.7 | Miyazaki 97.1 | 1.05 | 1.06 |
| Transport and communication | 16.9% | Tokyo 103.5 | Kagoshima 97.2 | 1.06 | 1.06 |
| Education | 4.2% | Osaka 124.7 | Toyama 78.1 | 1.60 | 1.59 |
| Culture and recreation | 10.8% | Kanagawa 107.3 | Kagoshima 91.9 | 1.17 | 1.17 |
| Miscellaneous | 6.9% | Kanagawa 105.6 | Aomori 89.3 | 1.18 | 1.16 |
Shares are calculated from the 2025 national weights[7]. Food, more than 30% of spending, varies by only 1.12 times, while housing and education, which vary widely, make up just 7.2% and 4.2% of spending. That combination is why the all-items gap stays at 1.08 times.
Housing: Tokyo stands out at 129.8, and only six prefectures are above 100
Only six prefectures have a housing index above 100: Tokyo (129.8), Chiba (111.8), Kanagawa (110.7), Saitama (104.5), Kyoto (102.2) and Miyazaki (101.3). The lowest is Okayama (79.1), followed by Ishikawa (82.0) and Shiga (83.3)[1]. The housing ratio widened from 1.56 to 1.64 times, the largest increase of the ten categories.
Across prefectures, the correlation between the housing index and private rents from the Housing and Land Survey is 0.78, so the two broadly point the same way[11]. Their sizes differ, though. Tokyo’s rent is 1.45 times the national average, or 1.70 times per tatami mat, while its housing index is 1.30 times. The housing index covers not only rent but also repairs and maintenance, and it is designed to compare quality-matched prices such as rent per unit of floor area. The surveys also work differently, so rather than one being right and the other wrong, it is better to treat them as two different rulers for the same gap in rents.
Food: Okinawa is highest at 106.6 and Nagano cheapest at 95.0
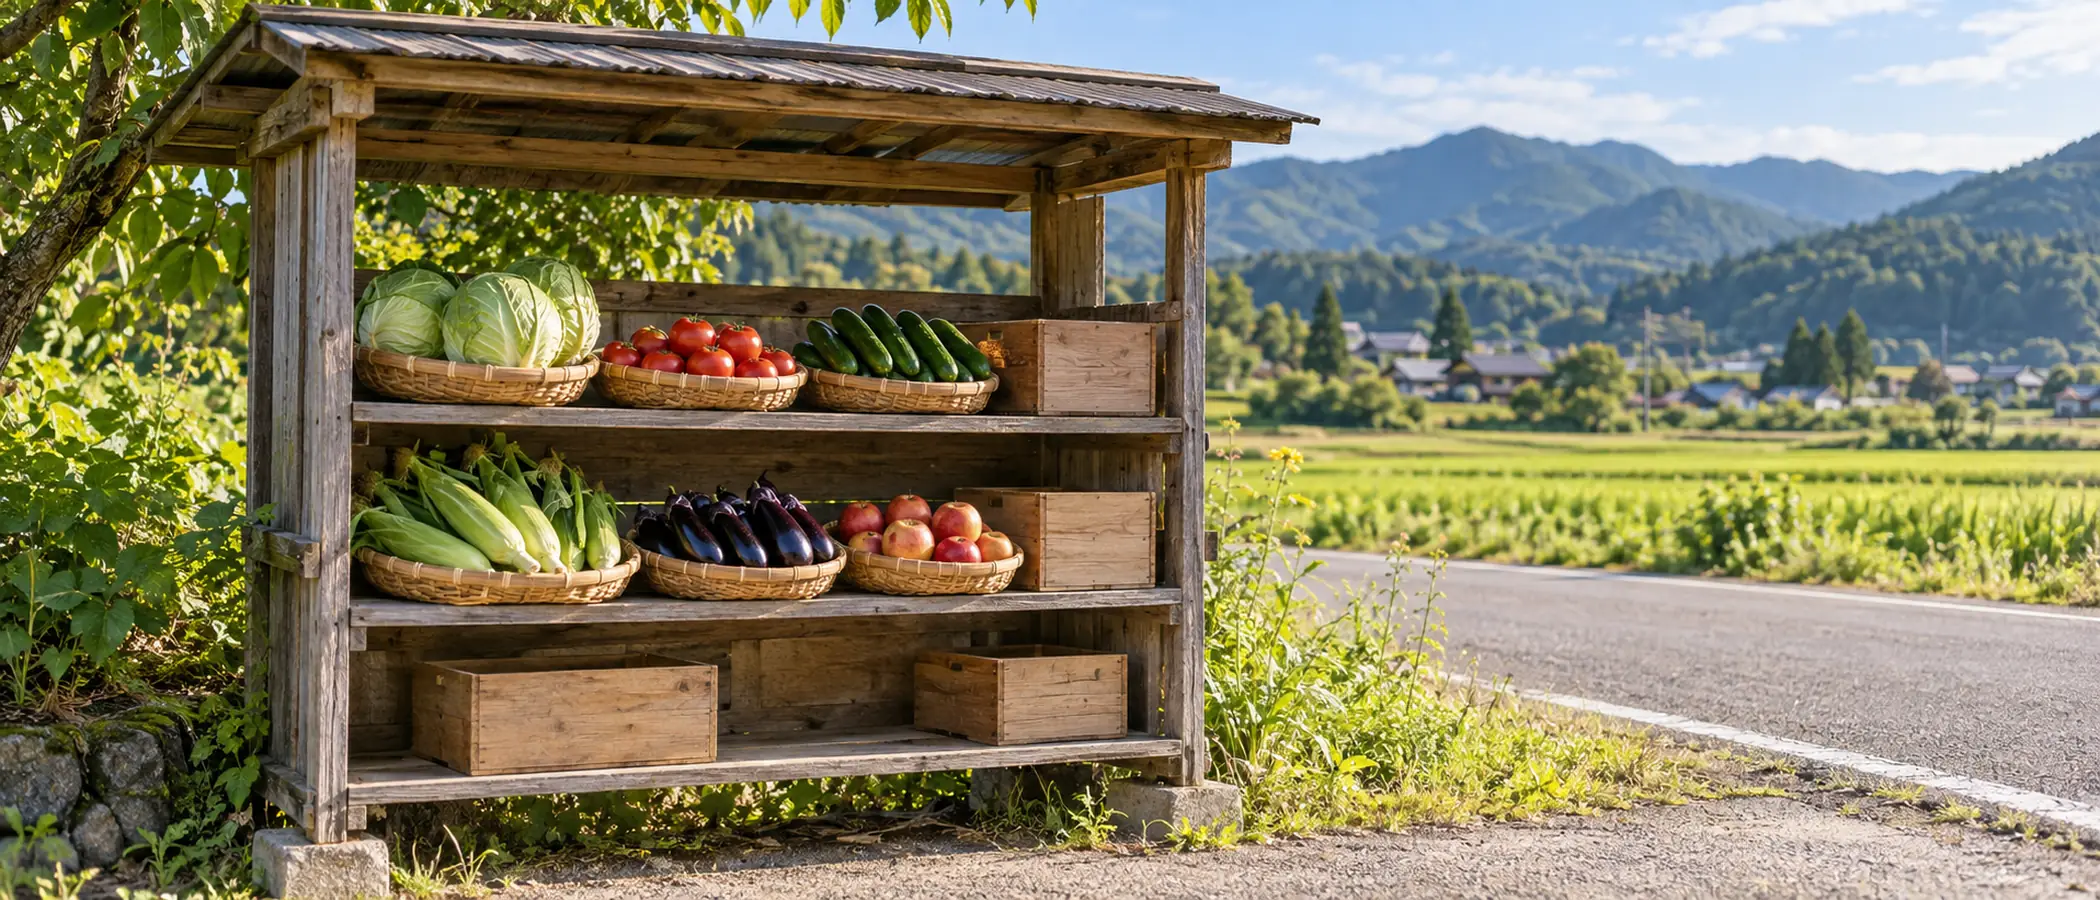
Food is about 30% of spending. Between the cheapest, Nagano, and the most expensive, Okinawa, the gap is 1.12 times.
The food index is highest in Okinawa (106.6), then Kumamoto (103.3) and Tokyo (102.9). The lowest is Nagano (95.0), followed by Gunma (95.5) and Aomori (97.1)[1].
Because food is about 30% of spending, even small differences matter for the all-items index. In Okinawa, food pushes the all-items index up by 2.12 points (section 5), and Okinawa also has the largest food weight in Japan at 35.2%[7]. Conversely, in Gunma, the cheapest prefecture overall, and Nagano, the third cheapest, cheap food is the biggest factor pulling the index down.
Fuel, light and water: high in Hokkaido and Tohoku, low in Osaka and Tokyo

Fuel, light and water is most expensive in Hokkaido at 117.8. The colder the region, the bigger its share of the household budget.
Fuel, light and water (charges for electricity, gas, kerosene, water and sewerage) is highest in Hokkaido (117.8), Iwate (112.2) and Aomori (110.3). The lowest is Osaka (90.6), followed by Tokyo (93.7) and Shiga and Hyogo (both 95.5)[1].
Tokyo is first overall but has the second-cheapest fuel, light and water in the country. Of the ten categories, it is the only one pulling Tokyo’s all-items index down (a contribution of −0.51). In Hokkaido and Tohoku, these charges are not only higher but also take a bigger share of spending. In Akita (11.6%), Aomori and Yamagata (11.4%), Hokkaido (11.2%) and Iwate (11.1%), the share is about 3 points above the national 8.3%[7]. In areas that use more energy, for winter heating and so on, price differences are likely to hit household budgets harder.
The ratio for fuel, light and water narrowed from 1.37 to 1.30 times. Hokkaido fell from 119.6 to 117.8 and Osaka rose from 87.0 to 90.6[2][1].
Education: Osaka 124.7, Toyama 78.1, a gap of 1.60 times
Education (tuition, textbooks and reference books, and supplementary education such as cram schools) is led by Kinki prefectures: Osaka (124.7), Kyoto (118.6) and Shiga (112.4). The lowest is Toyama (78.1), followed by Yamaguchi (81.6) and Akita (83.9)[1]. At 1.60 times, the gap is second only to housing.
Education makes up just 4.2% of spending, yet it pushes Osaka’s all-items index up by 1.02 points and Kyoto’s by 0.74 points. Osaka’s housing index (98.0) is below the national average and its fuel, light and water is the cheapest in Japan, so without education its all-items index would be lower still. Note, however, that education includes charges set by public policy, such as tuition. The bureau notes that where a surveyed price is free, as with school lunches in some municipalities, that item is excluded from the calculation for that municipality[1]. The figure does not directly show differences in what each household pays.
Categories with small gaps: medical care and transport and communication
The smallest gap is in medical care (1.05 times), followed by transport and communication (1.06 times)[1]. This is probably because many items, such as medical fees, medicines, phone charges and rail fares, follow largely nationwide pricing. Transport and communication is highest in Tokyo (103.5) and lowest in Kagoshima (97.2), Okinawa (97.7) and Ibaraki (97.8).
5. What pushes prices up: housing in Tokyo, food in Okinawa, fuel, light and water in Hokkaido
The bureau breaks down how far each prefecture’s all-items index is from the national average (100) into contributions by category[1]. You can think of a contribution as a category’s price level multiplied by its weight.
| Prefecture | All items | Largest upward contribution | Largest downward contribution |
|---|---|---|---|
| Tokyo | 104.2 | Housing +2.16 | Fuel, light and water −0.51 |
| Kanagawa | 103.3 | Food +0.88 | Furniture and household utensils −0.09 |
| Hokkaido | 102.4 | Fuel, light and water +1.61 | Housing −0.58 |
| Kyoto | 101.1 | Education +0.74 | Fuel, light and water −0.33 |
| Okinawa | 100.4 | Food +2.12 | Miscellaneous −0.56 |
| Osaka | 99.9 | Education +1.02 | Fuel, light and water −0.81 |
| Okayama | 97.7 | Food +0.33 | Housing −1.50 |
| Nagano | 96.9 | Fuel, light and water +0.36 | Food −1.59 |
| Kagoshima | 96.4 | (no upward category) | Culture and recreation −0.83 |
| Gunma | 96.2 | Fuel, light and water +0.24 | Food −1.40 |
Of Tokyo’s +4.2, just over half, 2.16 points, comes from housing. Even so, food (+0.94), culture and recreation (+0.64) and transport and communication (+0.53) also push upward, which is why Tokyo is still third even with rent excluded.
Across all 47 prefectures, the category with the largest upward contribution is most often fuel, light and water (21 prefectures), followed by food (11) and education (7). The seven where education leads are the six prefectures of the Kinki region plus Mie. The category with the largest downward contribution is most often housing (22 prefectures), and housing makes a negative contribution in 41. Much of the cheapness of regional prices comes from cheap housing, partly offset by higher fuel, light and water charges. Kagoshima is the only prefecture where all ten categories pull the index below the national average.
6. Compared with the previous year: Miyazaki rises from 45th to 32nd, Yamagata falls from 4th to 9th
Compared with 2024, the all-items index rose in 17 prefectures, fell in 20 and was unchanged in 10[2][1].
| Prefecture | 2024 → 2025 | Rank | Categories that moved most |
|---|---|---|---|
| Miyazaki | 97.0 → 98.0 (+1.0) | 45th → 32nd | Housing 98.5 → 101.3 |
| Saga | 97.7 → 98.5 (+0.8) | 38th → 28th | Housing 87.4 → 90.2, food 98.3 → 99.9 |
| Osaka | 99.3 → 99.9 (+0.6) | 16th → 11th | Fuel, light and water 87.0 → 90.6 |
| Ehime | 98.6 → 99.2 (+0.6) | 26th → 20th | Housing 85.0 → 86.5 |
| Fukuoka | 98.0 → 98.5 (+0.5) | 35th → 28th | Housing 90.5 → 96.4 |
| Yamagata | 101.4 → 100.1 (−1.3) | 4th → 9th | Housing 100.1 → 93.5 |
| Nagano | 97.9 → 96.9 (−1.0) | 37th → 45th | Housing 90.9 → 89.4, education 88.4 → 86.4 |
| Shiga | 98.6 → 97.7 (−0.9) | 26th → 37th | Housing 88.8 → 83.3 |
| Chiba | 101.2 → 100.5 (−0.7) | 5th → 5th | Housing 114.4 → 111.8 |
Tokyo rose from 104.0 to 104.2, and its housing index from 127.2 to 129.8. The cheapest, Gunma (96.2), and the second cheapest, Kagoshima (96.4), were unchanged.
Two cautions when reading year-on-year changes
First, the index shows a relative position, with that year’s national average at 100. The bureau itself notes that changes in index values do not represent changes in an area’s prices over time[1]. Miyazaki’s +1.0, for example, does not mean prices in Miyazaki rose 1%; it means its position relative to the national average rose by 1 point. Prices themselves rose across the country: the national CPI (all items) for 2025 was up 3.2% on the previous year[9].
Second, the basis of the calculation changed. The 2025 results use the 2025-base method, while the 2024 results used the 2020-base method[4][2]. Because items and weights were revised, a one-year change can mix price movements with changes in the method. Categories with large differences to begin with, such as housing and education, also move a lot (year-on-year changes ranged from −6.6 to +5.9 for housing and from −12.0 to +8.3 for education). One year of movement is too little to conclude that prices in a given prefecture tend to rise.
7. Adjusting pay and minimum wages for prices: the pay gap shrinks from 1.69 to 1.59 times, the minimum wage gap from ¥195 to ¥156

The same income buys slightly different amounts in different regions, but the difference is much smaller than the difference in income.
Once regional price differences are known, you can roughly compare how much the same pay can buy. Here I divided the estimated annual pay and minimum wages from the site’s existing data by the all-items index (amount ÷ index × 100).
Estimated annual pay: Tokyo stays first and Aichi moves up to second
I used the estimated annual pay calculated in Average Salary by Prefecture (2025 Basic Survey on Wage Structure, full-time regular workers, monthly pay × 12 + annual bonus)[10].
| Price-adjusted rank | Prefecture | Price-adjusted pay | Estimated pay (rank) | All-items index |
|---|---|---|---|---|
| 1 | Tokyo | ¥6.507m | ¥6.780m (1st) | 104.2 |
| 2 | Aichi | ¥5.820m | ¥5.704m (3rd) | 98.0 |
| 3 | Kanagawa | ¥5.732m | ¥5.921m (2nd) | 103.3 |
| 4 | Osaka | ¥5.510m | ¥5.504m (4th) | 99.9 |
| 5 | Hyogo | ¥5.488m | ¥5.455m (5th) | 99.4 |
| 45 | Miyazaki | ¥4.200m | ¥4.116m (45th) | 98.0 |
| 46 | Okinawa | ¥4.098m | ¥4.114m (46th) | 100.4 |
| 47 | Aomori | ¥4.094m | ¥4.008m (47th) | 97.9 |
The gap between the highest, Tokyo, and the lowest, Aomori, narrows from 1.69 to 1.59 times. Adjusting by all items less rent gives 1.64 times, an even smaller narrowing. Lower prices close only a small part of the pay gap. Ranks move much only for a few prefectures, such as low-price Gunma (22nd → 15th) and higher-price Hokkaido (30th → 36th).
The link between prices and pay is weak, too. Across the 47 prefectures, the correlation between the all-items index and estimated pay is 0.33, and between all items less rent and pay just 0.10. Apart from rent, there is almost no tendency for higher-paying areas to have higher prices.
Minimum wage: adjusted for prices, Kanagawa comes first and the gap shrinks to ¥156
I adjusted the FY2026 hourly minimum wage by the all-items index in the same way[12].
| Price-adjusted rank | Prefecture | Price-adjusted minimum wage | FY2026 minimum wage (rank) |
|---|---|---|---|
| 1 | Kanagawa | ¥1,238 | ¥1,279 (2nd) |
| 2 | Osaka | ¥1,232 | ¥1,231 (3rd) |
| 3 | Tokyo | ¥1,228 | ¥1,280 (1st) |
| 4 | Aichi | ¥1,219 | ¥1,195 (5th) |
| 5 | Saitama | ¥1,194 | ¥1,196 (4th) |
| 43 | Yamagata and Nagasaki | ¥1,091 | ¥1,092 (35th) and ¥1,087 (44th) |
| 45 | Iwate | ¥1,090 | ¥1,090 (39th) |
| 46 | Kochi | ¥1,087 | ¥1,086 (45th) |
| 47 | Okinawa | ¥1,082 | ¥1,086 (45th) |
The gap between the highest and lowest minimum wages is ¥195, but adjusted for prices it shrinks to ¥156 (Kanagawa’s ¥1,238 minus Okinawa’s ¥1,082). Ranks also move more than for pay. Low-price Kagoshima rises from 39th to 22nd and Miyazaki from 47th to 32nd, while higher-price Hokkaido falls from 14th to 37th.
Adjusted by all items less rent, however, Tokyo returns to first at ¥1,252 and the gap is ¥180. How it feels depends on how many people earning close to the minimum wage pay rent.
To compare take-home pay, first use the take-home pay calculator to subtract tax and social insurance from gross pay, then divide by the index in the same way. Taxes and social insurance contributions are set independently of regional price differences.
8. Cautions: a two-or-more-person household’s basket, no owner-occupied housing, no differences within prefectures
This index is the most complete official yardstick for comparing regional prices, but it does not measure living costs as such. If you use it to decide on a move or a transfer, keep the following in mind.
- It measures differences in prices, not in quantities. Differences in lifestyle, such as heating for longer in cold areas or owning several cars, are hardly reflected. For reference, the weights show transport and communication taking a large share of spending in Ishikawa (21.5%), Fukui (21.4%) and Saga (20.8%), and a small share in Tokyo (12.7%), Kanagawa (14.5%) and Kyoto (15.0%)[7]. Even where price differences are small, differences in quantity can be large.
- The weights come from households of two or more people. The way single-person households spend is not directly included in the weights[4].
- Owner-occupied housing costs are not included. All items and housing exclude imputed rent for owner-occupied housing[5]. Differences in mortgage payments or house prices are not measured by this index either.
- Differences within a prefecture are not visible. In the city-level index, Tokyo’s 23 wards were 105.3, Yokohama 103.8 and Kawasaki 103.7[1]. Even within one prefecture, price levels may differ between the capital and suburbs or mountain areas.
- It compares prices of quality-matched items. The goods and types of shops available differ by region, but the index compares specified, quality-matched varieties. Differences in how people shop, such as making good use of discount stores or sales, are not included either[1].
9. Summary: prices differ by 1.08 times, far less than pay or rent
- In 2025 the overall price level was highest in Tokyo at 104.2 and lowest in Gunma at 96.2. The gap is 1.08 times and has moved between 1.08 and 1.10 times since 2013. Tokyo has been first for 13 years in a row.
- With rent excluded, Hokkaido (103.2) comes first and Tokyo drops to third. Saitama (7th → 15th) and Osaka (11th → 18th) also fall when rent is excluded.
- By category, the gaps are large for housing (1.64 times) and education (1.60 times) and small for food (1.12 times) and transport and communication (1.06 times). Housing pushes up Tokyo’s index, food Okinawa’s, fuel, light and water Hokkaido’s, and education Osaka’s.
- Compared with the previous year, Miyazaki moved from 45th to 32nd and Yamagata from 4th to 9th. But the index is a position relative to the national average, and the basis of the method also changed from 2025.
- Adjusted for prices, the gap in estimated pay narrows from 1.69 to 1.59 times and the gap in minimum wages from ¥195 to ¥156. The gaps shrink, but the differences in pay remain much larger.
When you think about how much living costs fall if you move to a regional area, this index shows that differences in the prices of goods and services are only a few percent, and that what really differs is the price of housing. When comparing places to live, look not only at the price index but also at rent, how much driving and heating you will need, and pay, side by side.
This article is for information only and does not recommend moving to or working in any particular area. Price indices, ranks, contributions and ratios are from the Statistics Bureau of Japan’s published materials (2025 results, published 18 September 2026). Rent’s share of spending, price-adjusted pay and minimum wages, and correlation coefficients are the article’s own estimates from published statistics and do not include taxes, social insurance contributions or differences in individual households’ lifestyles. The data and script used are in the site’s repository (docs/data/price-index-by-prefecture.json, price_index.py).
References
- [1]Statistics Bureau of Japan, Regional Difference Index of Consumer Prices: results of the 2025 Retail Price Survey (structural survey), published 18 September 2026. Trend in the all-items index (table 1), ratios of highest to lowest by category (table 2), index by ten major categories (appendix table 1), index by city (appendix table 2), contributions (appendix table 3) and survey outline (Japanese). Statistics Bureau (PDF) ↩
- [2]Statistics Bureau of Japan, Regional Difference Index of Consumer Prices: results of the 2024 Retail Price Survey (structural survey), published 27 June 2025 (Japanese). Statistics Bureau (PDF) ↩
- [3]Statistics Bureau of Japan, Retail Price Survey (structural survey): survey results, listing the latest and past results (Japanese). Statistics Bureau ↩
- [4]Statistics Bureau of Japan, How the Regional Difference Index of Consumer Prices is compiled (2025 base): 588 items, Fisher-type formula, weights from the Family Income and Expenditure Survey (Japanese). Statistics Bureau (PDF) ↩
- [5]Statistics Bureau of Japan, Retail Price Survey (structural survey): glossary (all items, all items less rent, imputed rent for owner-occupied housing, ten major categories) (Japanese). Statistics Bureau (PDF) ↩
- [6]Ministry of Internal Affairs and Communications, Retail Price Survey (structural survey) 2025: Regional Difference Index of Consumer Prices by ten major categories (national average = 100) for the nation, regions, prefectures, prefectural capitals and designated cities, released 18 September 2026 (Japanese). e-Stat (Excel) ↩
- [7]Ministry of Internal Affairs and Communications, Retail Price Survey (structural survey) 2025: reference table of weights by ten major categories, released 18 September 2026. Rent’s share of spending is calculated in this article from the difference between the all-items and all-items-less-rent weights, and category shares by dividing each category’s weight by the all-items weight (Japanese). e-Stat (Excel) ↩
- [8]Ministry of Internal Affairs and Communications, Retail Price Survey (structural survey) 2024: Regional Difference Index of Consumer Prices by ten major categories (national average = 100), released 27 June 2025 (Japanese). e-Stat (Excel) ↩
- [9]Statistics Bureau of Japan, 2020-base Consumer Price Index for Japan, 2025 annual average, published 23 January 2026 (Japanese). Statistics Bureau ↩
- [10]Ministry of Health, Labour and Welfare, 2025 Basic Survey on Wage Structure, prefectural reference table 1 for all 47 prefectures (published 24 March 2026). Estimated annual pay is calculated as in Average Salary by Prefecture in Japan: 2026 Ranking (Japanese). e-Stat ↩
- [11]Ministry of Internal Affairs and Communications, 2023 Housing and Land Survey, basic tabulation table 112-2 (monthly rent of private rental housing). Prefectural figures are the same as in Rent by Prefecture in Japan: 2026 Ranking (Japanese). e-Stat ↩
- [12]Ministry of Health, Labour and Welfare, list of regional minimum wages for FY2026. Prefectural amounts are the same as in Minimum Wage by Prefecture in Japan: FY2026 Ranking (Japanese). MHLW (PDF) ↩

NEW NOVEL 2026/08/01
Clouded Glass
Polishing is not about force.
Volume two of The World Became Slightly Farther Away.Five stories that can also be read as a starting point.
View on Amazon
Jijoden.com
Your life is worth writing.
There is a truer self you can tell only to AI.Gather fragments of memory into a single story.
Take a LookRelated Articles
Average Age at First Marriage by Prefecture in Japan: The Latest Ranking, With Tokyo Highest and Shimane Lowest for Both Husbands and Wives
Using the latest final vital statistics from Japan’s health ministry (2025 data, published September 2026), this ranks all 47 prefectures by the average age at first marriage for husbands and wives. Nationally it is 31.0 for husbands and 29.7 for wives. Tokyo is highest and Shimane lowest for both. It also covers trends since 1950, how regional gaps have changed, the age gap between spouses and mothers’ age at first birth.
Life Expectancy by Prefecture in Japan: The Latest Ranking, With Shiga First for Men, Okayama First for Women and a 3.46-Year Gap to Aomori
Using the latest Prefectural Life Tables from Japan’s health ministry (2020 tables, published December 2022), this ranks all 47 prefectures by life expectancy for men and women. Shiga leads for men at 82.73 years, Okayama for women at 88.29, and Aomori is last for both. It also covers rankings by age, trends since 1965, healthy life expectancy and the latest national figures from the 2025 abridged life table.
Rent by Prefecture in Japan: 2026 Ranking as Tokyo’s ¥94,800 Is Twice Miyazaki’s, and 2.8 Times the Cheapest per Tatami
Using the latest Housing and Land Survey from Japan’s internal affairs ministry (2023), I ranked all 47 prefectures by monthly rent and rent per tatami for private rental housing. Tokyo is highest at ¥94,802 and Miyazaki lowest at ¥46,290. Tokyo’s 23 wards, change since 2018, the August 2026 Retail Price Survey and rent relative to pay are covered too.
Minimum Wage by Prefecture in Japan: FY2026 Ranking as Tokyo’s ¥1,280 and Miyazaki’s ¥1,085 Leave the Smallest Gap in a Decade
Using the labour ministry’s list of regional minimum wages, I ranked all 47 prefectures by their FY2026 hourly minimum wage. Tokyo is highest at ¥1,280 and Miyazaki lowest at ¥1,085, and the national weighted average rose ¥56 to ¥1,177. Effective dates from 1 October to 2 December, the national guideline, ten years of history, full-time annual pay, and the weight relative to average pay and rent are covered too.
Average Salary by Prefecture in Japan: 2026 Ranking as Tokyo Reaches an Estimated ¥6.78 Million, 1.69 Times Aomori
Using the latest Basic Survey on Wage Structure from Japan’s labour ministry (2025 survey, published March 2026), I estimated annual pay for all 47 prefectures with one formula: monthly pay × 12 + annual bonuses. Tokyo leads at ¥6.78 million, followed by Kanagawa and Aichi; Aomori is last at ¥4.01 million. Gender gaps, year-on-year change and regional prices are covered too.
From the Pocho Lab
