

Table of Contents
When you set a part-time hourly rate, compare job ads, or look for work after moving to another part of Japan, one number keeps coming up: the minimum wage. It is revised every autumn. But the day the new rate starts differs by prefecture, the regional gap has narrowed over the past decade, and its weight relative to typical local pay varies a lot by region.
This article ranks all 47 prefectures using the labour ministry’s list of regional minimum wages for fiscal year 2026 (FY2026, April 2026–March 2027) and its table of revisions since FY2002[1][2]. After looking at the size of the increase, the effective dates and ten years of history, I also calculate what the minimum wage means as annual pay for a full-time schedule, and how heavy it is compared with average pay by prefecture and rent.
1. The short answer: Tokyo is highest at ¥1,280, Miyazaki lowest at ¥1,085, and the ¥195 gap is the smallest in ten years
- Tokyo has the highest FY2026 minimum wage, at ¥1,280 an hour. Kanagawa is second (¥1,279) and Osaka third (¥1,231)[1].
- Miyazaki is last at ¥1,085. Kochi and Okinawa are just ¥1 above, at ¥1,086.
- The national weighted average is ¥1,177, up ¥56 or 5.0% from ¥1,121 in FY2025. A ¥56 rise is the second largest since the guideline system began in FY1978[3].
- The gap between highest and lowest is ¥195. The lowest rate is 84.8% of the highest, an improvement for the 12th year in a row[3]. The gap in yen has also shrunk from ¥218 in FY2016 and is the smallest of the past ten years.
- 29 prefectures are at ¥1,100 or more, and 18 are below it. Those 18 are packed into a ¥13 band from ¥1,085 to ¥1,098.
- Effective dates are scattered. Only 15 prefectures switched on 1 October, and the last, Okinawa, switches on 2 December. As of 21 October 2026, 32 prefectures are on the new rate.
- Full time (2,000 hours a year), that is ¥2.560 million a year in Tokyo and ¥2.170 million in Miyazaki. Relative to estimated average pay, it is 37.8% in Tokyo and 54.4% in Aomori: the further from the big cities, the closer the minimum wage is to typical pay.
What the regional minimum wage is
The minimum wage is a legal floor on pay set by the state under the Minimum Wage Act. If an employer and worker agree on a lower rate, that part is void and treated as an agreement at the minimum wage[7].
- The regional minimum wage applies to every worker and employer at workplaces in the prefecture, whatever the industry or job. It covers part-timers and casual staff as well as regular employees. Dispatched (agency) workers get the rate of the prefecture where the client workplace is[9].
- Some industries also have a "specific minimum wage". Where both apply, the employer must pay at least the higher one[9].
- Rates are set by each prefectural labour bureau director after deliberation by the local minimum wage council. The council weighs (1) workers’ cost of living, (2) workers’ wages and (3) the ability of ordinary businesses to pay, and for the cost of living it must take consistency with public assistance into account[7].
- Since FY2002, rates have been set as hourly amounts only[7].
2. The full ranking: seven prefectures are above the national average, and the bottom 18 sit within ¥13
| Rank | Prefecture | FY2026 | FY2025 | Increase (rate) | Vs. guideline | Takes effect |
|---|---|---|---|---|---|---|
| 1 | Tokyo | ¥1,280 | ¥1,226 | +¥54 (4.4%) | ±0 | 1 Oct |
| 2 | Kanagawa | ¥1,279 | ¥1,225 | +¥54 (4.4%) | ±0 | 1 Oct |
| 3 | Osaka | ¥1,231 | ¥1,177 | +¥54 (4.6%) | ±0 | 1 Oct |
| 4 | Saitama | ¥1,196 | ¥1,141 | +¥55 (4.8%) | +¥1 | 1 Oct |
| 5 | Chiba | ¥1,195 | ¥1,140 | +¥55 (4.8%) | +¥1 | 1 Oct |
| 5 | Aichi | ¥1,195 | ¥1,140 | +¥55 (4.8%) | +¥1 | 1 Oct |
| 7 | Kyoto | ¥1,180 | ¥1,122 | +¥58 (5.2%) | +¥2 | 16 Nov |
| 8 | Hyogo | ¥1,172 | ¥1,116 | +¥56 (5.0%) | ±0 | 1 Oct |
| 9 | Shizuoka | ¥1,154 | ¥1,097 | +¥57 (5.2%) | +¥1 | 15 Oct |
| 10 | Mie | ¥1,143 | ¥1,087 | +¥56 (5.2%) | ±0 | 1 Oct |
| 11 | Hiroshima | ¥1,141 | ¥1,085 | +¥56 (5.2%) | ±0 | 11 Oct |
| 12 | Ibaraki | ¥1,136 | ¥1,074 | +¥62 (5.8%) | +¥6 | 18 Oct |
| 12 | Shiga | ¥1,136 | ¥1,080 | +¥56 (5.2%) | ±0 | 3 Oct |
| 14 | Hokkaido | ¥1,131 | ¥1,075 | +¥56 (5.2%) | ±0 | 1 Oct |
| 15 | Tochigi | ¥1,125 | ¥1,068 | +¥57 (5.3%) | +¥1 | 1 Oct |
| 16 | Gifu | ¥1,121 | ¥1,065 | +¥56 (5.3%) | ±0 | 1 Oct |
| 17 | Gunma | ¥1,120 | ¥1,063 | +¥57 (5.4%) | +¥1 | 3 Oct |
| 18 | Toyama | ¥1,119 | ¥1,062 | +¥57 (5.4%) | +¥1 | 1 Oct |
| 19 | Nagano | ¥1,117 | ¥1,061 | +¥56 (5.3%) | ±0 | 2 Oct |
| 20 | Fukuoka | ¥1,114 | ¥1,057 | +¥57 (5.4%) | +¥1 | 4 Oct |
| 21 | Ishikawa | ¥1,113 | ¥1,054 | +¥59 (5.6%) | +¥3 | 3 Oct |
| 21 | Yamanashi | ¥1,113 | ¥1,052 | +¥61 (5.8%) | +¥5 | 1 Nov |
| 23 | Fukui | ¥1,112 | ¥1,053 | +¥59 (5.6%) | +¥3 | 4 Oct |
| 24 | Niigata | ¥1,108 | ¥1,050 | +¥58 (5.5%) | +¥2 | 1 Oct |
| 25 | Nara | ¥1,107 | ¥1,051 | +¥56 (5.3%) | ±0 | 4 Oct |
| 26 | Okayama | ¥1,104 | ¥1,047 | +¥57 (5.4%) | +¥1 | 2 Oct |
| 27 | Tokushima | ¥1,103 | ¥1,046 | +¥57 (5.4%) | +¥1 | 1 Nov |
| 28 | Wakayama | ¥1,101 | ¥1,045 | +¥56 (5.4%) | ±0 | 3 Oct |
| 28 | Yamaguchi | ¥1,101 | ¥1,043 | +¥58 (5.6%) | +¥2 | 8 Oct |
| 30 | Miyagi | ¥1,098 | ¥1,038 | +¥60 (5.8%) | +¥4 | 1 Oct |
| 31 | Oita | ¥1,096 | ¥1,035 | +¥61 (5.9%) | +¥5 | 1 Nov |
| 32 | Saga | ¥1,095 | ¥1,030 | +¥65 (6.3%) | +¥9 | 15 Nov |
| 33 | Fukushima | ¥1,094 | ¥1,033 | +¥61 (5.9%) | +¥5 | 16 Oct |
| 34 | Ehime | ¥1,093 | ¥1,033 | +¥60 (5.8%) | +¥4 | 1 Nov |
| 35 | Yamagata | ¥1,092 | ¥1,032 | +¥60 (5.8%) | +¥4 | 30 Oct |
| 35 | Shimane | ¥1,092 | ¥1,033 | +¥59 (5.7%) | +¥3 | 10 Oct |
| 35 | Kagawa | ¥1,092 | ¥1,036 | +¥56 (5.4%) | ±0 | 1 Oct |
| 35 | Kumamoto | ¥1,092 | ¥1,034 | +¥58 (5.6%) | +¥2 | 1 Dec |
| 39 | Aomori | ¥1,090 | ¥1,029 | +¥61 (5.9%) | +¥5 | 29 Oct |
| 39 | Iwate | ¥1,090 | ¥1,031 | +¥59 (5.7%) | +¥3 | 1 Dec |
| 39 | Akita | ¥1,090 | ¥1,031 | +¥59 (5.7%) | +¥3 | 14 Oct |
| 39 | Tottori | ¥1,090 | ¥1,030 | +¥60 (5.8%) | +¥4 | 3 Oct |
| 39 | Kagoshima | ¥1,090 | ¥1,026 | +¥64 (6.2%) | +¥8 | 25 Oct |
| 44 | Nagasaki | ¥1,087 | ¥1,031 | +¥56 (5.4%) | ±0 | 2 Nov |
| 45 | Kochi | ¥1,086 | ¥1,023 | +¥63 (6.2%) | +¥7 | 29 Oct |
| 45 | Okinawa | ¥1,086 | ¥1,023 | +¥63 (6.2%) | +¥7 | 2 Dec |
| 47 | Miyazaki | ¥1,085 | ¥1,023 | +¥62 (6.1%) | +¥6 | 24 Oct |
| – | National weighted average | ¥1,177 | ¥1,121 | +¥56 (5.0%) | +¥1 | – |
"Vs. guideline" is the difference between the actual increase and the increase recommended by the national Central Minimum Wages Council (explained below). Effective dates are those in the ministry’s list[1][4].
The top is the big metropolitan areas, and only seven are above the national average
Only seven prefectures exceed the national weighted average of ¥1,177: Tokyo, Kanagawa, Osaka, Saitama, Chiba, Aichi and Kyoto. The national figure weights each prefecture by the number of workers covered, so it is pulled towards the large metropolitan areas where most people work. The other 40 prefectures are below it.
Tokyo and Kanagawa are just ¥1 apart. There is a ¥35 step between third-placed Osaka (¥1,231) and fourth-placed Saitama (¥1,196), which separates the top three from everyone else.
At the bottom, prefectures are bunched ¥1 apart
The 18 prefectures from 30th-placed Miyagi (¥1,098) down to last-placed Miyazaki (¥1,085) fit within just ¥13. Five prefectures—Aomori, Iwate, Akita, Tottori and Kagoshima—share ¥1,090, and four more share ¥1,092.
In FY2025, Kochi, Miyazaki and Okinawa were tied for last at ¥1,023[2]. In FY2026 all three raised their rates by ¥6–7 more than the guideline, leaving Kochi and Okinawa at ¥1,086 and Miyazaki at ¥1,085. With places changing on a ¥1 difference, the "lowest" prefecture changes almost every year. It is more accurate to read the bottom group as being at practically the same level than to focus on the exact rank.
3. Effective dates: only 15 prefectures switched on 1 October, and the last, Okinawa, switches on 2 December
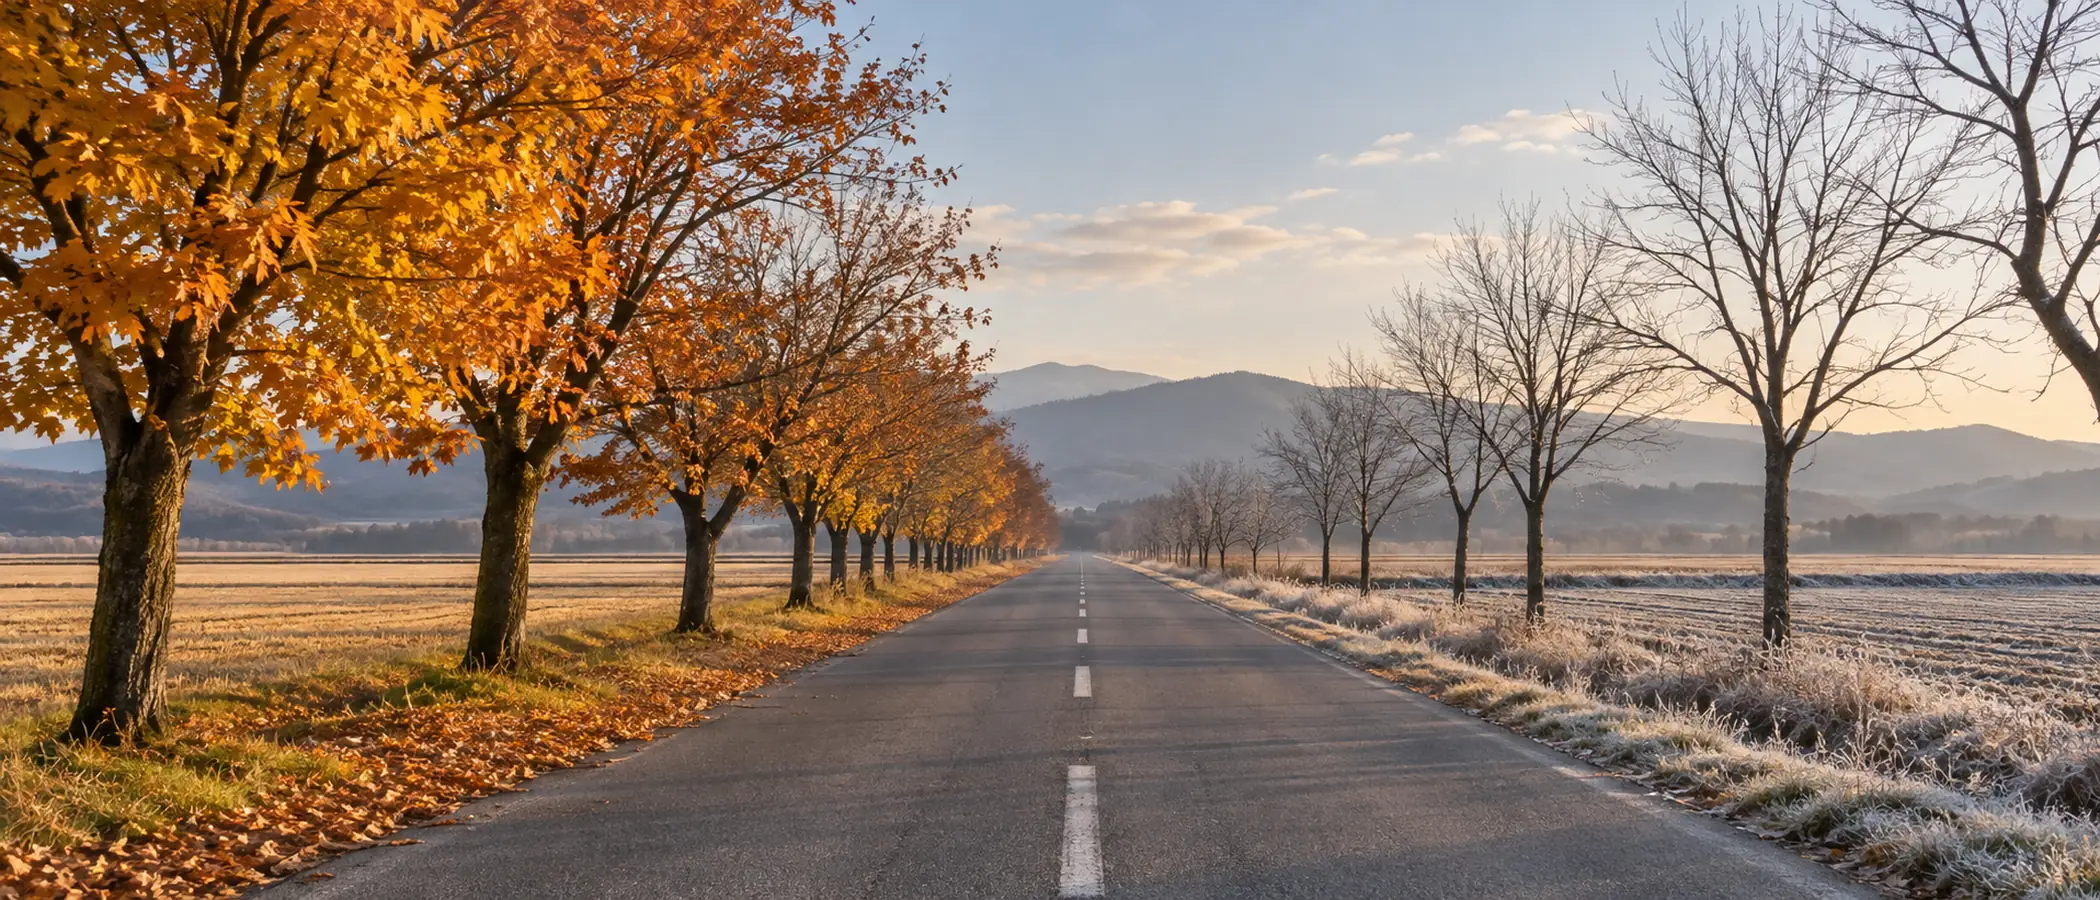
The day the new minimum wage starts differs by prefecture, from early autumn to the edge of winter.
The minimum wage is revised in the autumn, but the day the new rate takes effect varies by prefecture. Here are the FY2026 dates in order[1].
| Takes effect | Prefectures |
|---|---|
| 1 October | Hokkaido, Miyagi, Tochigi, Saitama, Chiba, Tokyo, Kanagawa, Niigata, Toyama, Gifu, Aichi, Mie, Osaka, Hyogo, Kagawa (15) |
| 2–4 October | Nagano, Okayama (2nd); Gunma, Ishikawa, Shiga, Wakayama, Tottori (3rd); Fukui, Nara, Fukuoka (4th) |
| 8–18 October | Yamaguchi (8th), Shimane (10th), Hiroshima (11th), Akita (14th), Shizuoka (15th), Fukushima (16th), Ibaraki (18th) |
| 24–30 October | Miyazaki (24th), Kagoshima (25th), Aomori and Kochi (29th), Yamagata (30th) |
| November | Yamanashi, Tokushima, Ehime, Oita (1st), Nagasaki (2nd), Saga (15th), Kyoto (16th) |
| December | Iwate and Kumamoto (1st), Okinawa (2nd) |
Thirty-seven prefectures switch in October, seven in November and three in December. On the day this article was published, 21 October 2026, 32 prefectures were on the new rate and the other 15 were still to change. Kyoto, for example, ranks seventh at ¥1,180, but the new rate starts only on 16 November; until then the FY2025 rate of ¥1,122 applies.
Why the dates differ, and last year’s big delays
The amount recommended by a local minimum wage council takes effect after a period in which employers’ and workers’ representatives can lodge objections, followed by a decision by the prefectural labour bureau director[3]. The date given at the recommendation stage is only "planned" and can change depending on objections and other factors[4].
The spread of dates widened sharply in FY2025. That year only 20 prefectures switched in October; 13 switched in November, eight in December, four in January 2026 and two in March 2026. The latest, Akita, switched on 31 March 2026, and moves to its FY2026 rate on 14 October, after about six months[2]. In FY2024, 46 of the 47 prefectures had switched in October, so the range of dates has widened a lot in two years. In FY2026 everything is in place by 2 December, earlier than last year.
For workers, "from when" matters as much as "how much". If your hourly rate on your payslip has not gone up, first check your prefecture’s effective date.
4. The increase and the national guideline: ¥56 overall, 33 prefectures above the guideline, and bigger rises in the regions
Each year’s revision starts with a "guideline" from the national Central Minimum Wages Council. Prefectures are grouped into three ranks, A, B and C, according to their economic situation, and the council recommends an increase for each rank. The guideline is a reference for the local councils and is not binding[7].
The FY2026 guideline was issued on 28 July 2026: ¥54 for rank A (Saitama, Chiba, Tokyo, Kanagawa, Aichi and Osaka) and ¥56 for both rank B (28 prefectures) and rank C (13 prefectures). If every prefecture had followed it, the national weighted average would have been ¥1,176, a rise of ¥55 (¥66 the year before) or 4.9% (6.3% the year before)[5]. Employers and unions did not agree on the amount, so the council passed on the public-interest members’ view to the local councils[5].
In the end, the local councils recommended increases of ¥54 to ¥65 across the 47 prefectures.
- 33 prefectures went above the guideline and 14 matched it. None went below[4].
- Saga had the biggest rise, ¥65 (6.3%), ¥9 above the guideline. Kagoshima followed at ¥64 (+¥8), then Kochi and Okinawa at ¥63 (+¥7).
- Tokyo, Kanagawa and Osaka had the smallest rise, ¥54. All six rank-A prefectures matched the guideline or went ¥1 above it.
- By rank, the average rise was ¥54.5 for rank A and ¥60.8 for rank C. The more rural the prefecture, the more it added on top of the guideline.
As the previous section showed, the lower-ranked prefectures are separated by ¥1. Adding a few yen to the guideline moves a prefecture up; not adding them can leave it last. That Kochi, Miyazaki and Okinawa—tied for last in FY2025—all went ¥6–7 above the guideline is a decision made within this tight bunching.
Compared with prices
The consumer price index (all items less imputed rent) referred to in setting the guideline rose by an average of 2.1% year on year between October 2025 and June 2026. Food was higher at 4.3%, although both rose more slowly than a year earlier (3.9% for the index and 6.4% for food)[6]. The national weighted minimum wage rose 5.0%, clearly above price growth.
5. Ten years of history: the national average rose 43% from ¥823 to ¥1,177, and the gap narrowed from ¥218 to ¥195
Here are the ten years since FY2016[2][8].
| Fiscal year | National weighted average | Change | Highest (Tokyo) | Lowest | Gap | Lowest ÷ highest |
|---|---|---|---|---|---|---|
| FY2016 | ¥823 | +¥25 | ¥932 | ¥714 (Miyazaki, Okinawa) | ¥218 | 76.6% |
| FY2017 | ¥848 | +¥25 | ¥958 | ¥737 (8 prefectures incl. Kochi) | ¥221 | 76.9% |
| FY2018 | ¥874 | +¥26 | ¥985 | ¥761 (Kagoshima) | ¥224 | 77.3% |
| FY2019 | ¥901 | +¥27 | ¥1,013 | ¥790 (15 prefectures incl. Aomori) | ¥223 | 78.0% |
| FY2020 | ¥902 | +¥1 | ¥1,013 | ¥792 (7 prefectures incl. Akita) | ¥221 | 78.2% |
| FY2021 | ¥930 | +¥28 | ¥1,041 | ¥820 (Kochi, Okinawa) | ¥221 | 78.8% |
| FY2022 | ¥961 | +¥31 | ¥1,072 | ¥853 (10 prefectures incl. Aomori) | ¥219 | 79.6% |
| FY2023 | ¥1,004 | +¥43 | ¥1,113 | ¥893 (Iwate) | ¥220 | 80.2% |
| FY2024 | ¥1,055 | +¥51 | ¥1,163 | ¥951 (Akita) | ¥212 | 81.8% |
| FY2025 | ¥1,121 | +¥66 | ¥1,226 | ¥1,023 (Kochi, Miyazaki, Okinawa) | ¥203 | 83.4% |
| FY2026 | ¥1,177 | +¥56 | ¥1,280 | ¥1,085 (Miyazaki) | ¥195 | 84.8% |
"Change" is the difference in the national weighted average in the ministry’s table, rounded to the nearest yen. The increases in FY2016 and FY2023 each include ¥1 from updating the worker numbers used for weighting[8].
Three distinct periods
- FY2016–FY2019: steady rises of ¥25–27 a year, in the 3% range. Tokyo and Kanagawa passed ¥1,000 for the first time in FY2019.
- FY2020: ¥1. This was the year the COVID-19 pandemic was spreading; seven prefectures (Hokkaido, Tokyo, Shizuoka, Kyoto, Osaka, Hiroshima and Yamaguchi) froze their rates, and the other 40 raised them by only ¥1–3[2].
- FY2023 onwards: big rises of ¥43, ¥51, ¥66 and ¥56. The national weighted average reached ¥1,000 for the first time in FY2023, and in FY2025 all 47 prefectures passed ¥1,000. In FY2026, 29 prefectures are at ¥1,100 or more.
Over ten years the national weighted average rose ¥354, or 43.0%. Compared with FY2002 (¥663), it is about 1.8 times as high[2].
The regional gap has narrowed both as a ratio and in yen
The lowest rate as a share of the highest has improved every year, from 76.6% in FY2016 to 84.8% in FY2026. The gap in yen has also fallen since peaking at ¥224 in FY2018, to ¥195 in FY2026.
By prefecture, the largest ten-year increase was Tokushima’s ¥387 (¥716 to ¥1,103, +54.1%). Tokushima raised its rate by ¥84 in a single year in FY2024 (¥896 to ¥980) and left the national bottom group[2]. Oita and Saga also rose by around ¥380. Tokyo rose ¥348 (+37.3%), the smallest percentage increase of all 47 prefectures. The regions have raised rates faster in percentage terms, and that is what has narrowed the gap.
How far from the ¥1,500 target
The government has set a target of a national average of ¥1,500 "in the 2020s", and its 2026 policy says it will reach it "as early as possible, by the early 2030s at the latest"[6]. From ¥1,177 in FY2026, that is ¥323 to go.
As simple arithmetic, reaching it by FY2029 would take rises of about 8.4% (about ¥108) a year over three revisions. At ¥56 a year, as in FY2026, it would be passed at the sixth revision (FY2032); at 5.0% a year, at the fifth (FY2031). If the pace of recent years continues, the level is within reach of the "early 2030s" goal.
6. What it means as full-time annual pay: ¥2.56 million in Tokyo, ¥2.17 million in Miyazaki, and 44% of monthly pay going on rent in Tokyo

Turning an hourly rate into an eight-hour, 250-day year shows what it means for everyday life.
The minimum wage is an hourly rate, so to relate it to daily life it helps to turn it into annual and monthly pay. I used the following assumption.
Annual pay = minimum wage × 2,000 hours (8 hours a day × 250 days a year)
Eight hours a day for 250 days is the same schedule the ministry uses in its worked example of how to check pay against the minimum wage[10]. The figures are gross, before tax and social insurance, and exclude overtime, bonuses and commuting allowances.
| Category | Minimum wage | Annual pay (2,000 hours) | Monthly pay (annual ÷ 12) |
|---|---|---|---|
| Highest (Tokyo) | ¥1,280 | ¥2.560 million | ¥213,333 |
| Second (Kanagawa) | ¥1,279 | ¥2.558 million | ¥213,167 |
| Third (Osaka) | ¥1,231 | ¥2.462 million | ¥205,167 |
| National weighted average | ¥1,177 | ¥2.354 million | ¥196,167 |
| Lowest (Miyazaki) | ¥1,085 | ¥2.170 million | ¥180,833 |
The difference between Tokyo and Miyazaki is ¥390,000 a year, or about ¥33,000 a month.
- Using the actual scheduled hours of full-time workers (national average of 162 hours in June 2025)[11] gives 1,944 hours a year, and the national weighted average would then be ¥2.288 million a year, about 3% less than with 2,000 hours.
- Doing the same calculation with the FY2016 national weighted average (¥823) gives ¥1.646 million a year, so the figure has grown by about ¥710,000 in ten years.
- The FY2026 rate applies only from each effective date, so the amount actually earned over calendar year 2026 is less than this calculation.
Take-home pay after tax and social insurance depends on age, dependants and insurance. To check your own case, try entering the annual figure into the take-home pay calculator (Japanese).
Compared with rent: 44% of monthly pay in Tokyo, 26% in Aomori and Miyazaki
I divided the average monthly rent of private rental housing (Housing and Land Survey, 2023)[12], as used in the rent ranking by prefecture, by the monthly pay above.
| Category | Prefecture | Monthly pay | Private rent | Rent as share of monthly pay |
|---|---|---|---|---|
| Heaviest | Tokyo | ¥213,333 | ¥94,802 | 44.4% |
| Second | Kanagawa | ¥213,167 | ¥76,356 | 35.8% |
| Third | Hyogo | ¥195,333 | ¥65,097 | 33.3% |
| Japan | Japan | ¥196,167 | ¥65,496 | 33.4% |
| Third lightest | Kagoshima, Oita | ¥181,667, ¥182,667 | ¥46,916, ¥47,163 | 25.8% |
| Second lightest | Miyazaki | ¥180,833 | ¥46,290 | 25.6% |
| Lightest | Aomori | ¥181,667 | ¥46,340 | 25.5% |
Tokyo has the highest minimum wage, but the rent gap (Tokyo is about 2.05 times Miyazaki) is far larger than the minimum wage gap (1.18 times). So for someone earning the minimum wage and renting privately, more than 40% of gross monthly pay goes on rent in Tokyo. In the regions the minimum wage is lower but so is rent, and the share stays in the mid-20s. Okinawa is 45th for the minimum wage but 15th for rent, so its share of 29.8% is the 12th heaviest.
These rents are averages for people already living in their homes, including households that moved in decades ago. Rooms rented now tend to cost more, so the shares here are probably on the low side.
7. Relative to average pay: under 40% in Tokyo and over 50% in Aomori, so the minimum wage is closer to typical pay in the regions

In the regions, the minimum wage sits close to the typical pay of the area.
The weight of the minimum wage is clearest when compared with typical pay in the same area. I compared the annual figure from the previous section with estimated annual pay from Average Salary by Prefecture (Basic Survey on Wage Structure 2025, full-time general workers, monthly pay × 12 + annual bonuses)[11].
| Category | Prefecture | Minimum wage, annual | Estimated annual pay | Share |
|---|---|---|---|---|
| Highest | Aomori | ¥2.180 million | ¥4.008 million | 54.4% |
| Second | Okinawa | ¥2.172 million | ¥4.114 million | 52.8% |
| Third | Miyazaki | ¥2.170 million | ¥4.116 million | 52.7% |
| Fourth | Yamagata | ¥2.184 million | ¥4.238 million | 51.5% |
| Japan | Japan | ¥2.354 million | ¥5.456 million | 43.1% |
| Third lowest | Ibaraki, Shiga | ¥2.272 million | ¥5.334 million, ¥5.337 million | 42.6% |
| Second lowest | Aichi | ¥2.390 million | ¥5.704 million | 41.9% |
| Lowest | Tokyo | ¥2.560 million | ¥6.780 million | 37.8% |
Across the 47 prefectures, the minimum wage and estimated pay move together quite closely (correlation coefficient 0.87). But the size of the gaps differs. Estimated pay in Tokyo is 1.69 times that of Aomori, while Tokyo’s minimum wage is only 1.18 times Miyazaki’s. Because only the minimum wage gap has narrowed, the minimum wage sits closer to typical pay the further you go from the big cities.
The same pattern on an hourly basis
You can also compare hourly rates, leaving bonuses out. Dividing scheduled pay in June 2025 (monthly pay excluding overtime and the like) by scheduled hours gives an average hourly rate of ¥2,102 nationally. The FY2025 minimum wage (¥1,121) is 53.3% of that[11].
- The highest share is Aomori (63.6%, average hourly ¥1,619), followed by Miyazaki (62.2%) and Yamagata (61.8%).
- The lowest is Tokyo (46.6%, average hourly ¥2,631), followed by Ibaraki (52.3%) and Shiga (52.8%).
The ministry’s council papers, using the same survey, estimate that the FY2025 minimum wage was 61.2% of the median and 53.0% of the mean scheduled pay of full-time workers[6]. The slight difference from this article’s 53.3% comes from published hours being rounded to whole hours. The same papers say that including bonuses and overtime in the hourly figure gives 50.0% of the median and 42.4% of the mean. Internationally, the OECD’s 2025 figure puts Japan’s minimum wage at 46.4% of the median wage, below France (62.5%) and the UK (61.9%). The EU minimum wage directive gives "60% of the median" and "50% of the mean" as examples of reference values for judging adequacy[6].
Points to keep in mind
- Pay is the average for full-time general workers, counted by place of work. Part-timers and other short-hour workers, and establishments with fewer than ten employees, are excluded. Compared with an average that included short-hour workers, the shares would be different.
- The timing is slightly off. For annual pay I used wages for June 2025 (bonuses for calendar 2024) against the FY2026 minimum wage. If wages have risen since, the actual shares are lower. The hourly comparison matches 2025 wages with the FY2025 minimum wage.
- A high share does not mean the regional minimum wage is "too high". It means that where the minimum wage is close to typical pay, relatively more workers and businesses are likely to be affected by each revision.
8. How to check that your pay is not below the minimum wage
If you are paid by the hour, just compare your hourly rate with the minimum wage. If you are paid monthly, convert to an hourly rate first. The ministry’s method is as follows[10][9].
- Remove pay that does not count towards the minimum wage. That means overtime, holiday and late-night premiums, commuting allowances, family allowances, perfect-attendance allowances, bonuses and other pay for periods longer than a month, and one-off payments such as a marriage allowance. Job allowances and the like are not removed.
- Convert to an hourly amount. For monthly pay, monthly pay ÷ average scheduled hours per month; for daily pay, daily pay ÷ scheduled hours per day.
- Compare with the minimum wage that applies. Use the rate for the prefecture where your workplace is. For dispatched workers, it is the client workplace’s prefecture.
For example, if your monthly pay after removing those items is ¥200,000 and your company’s scheduled hours are 2,000 a year (166.7 a month on average), your hourly amount is about ¥1,200. At FY2026 rates that is below the minimum wage in Tokyo (¥1,280), Kanagawa (¥1,279) and Osaka (¥1,231), and above it in the other 44 prefectures from Saitama (¥1,196) down. Do not judge by the ¥200,000 figure alone; divide by scheduled hours to check.
If you think your pay may be below the minimum wage, you can consult the prefectural labour bureau or your nearest labour standards inspection office[10].
9. Summary: the gap has narrowed, but the gap in living costs is, if anything, larger
- In FY2026, Tokyo has the highest minimum wage at ¥1,280 and Miyazaki the lowest at ¥1,085. The national weighted average is ¥1,177, up ¥56 (5.0%) from the year before.
- The gap between highest and lowest is ¥195, and the lowest is 84.8% of the highest. The regional gap is the smallest of the past ten years, both as a ratio and in yen. The more rural prefectures added more on top of the guideline, and the bottom 18 are packed within ¥13.
- Effective dates range from 1 October to 2 December, and as of 21 October 2026, 32 prefectures were on the new rate. Check the date for your prefecture.
- Full time (2,000 hours a year), annual pay is ¥2.560 million in Tokyo, ¥2.354 million nationally and ¥2.170 million in Miyazaki. But rent takes 44.4% of monthly pay in Tokyo, far more than anywhere else, against the mid-20s in the regions.
- Relative to typical pay, the minimum wage is 37.8% of estimated annual pay in Tokyo and 54.4% in Aomori. In the regions it sits closer to typical pay, so each year’s revision is likely to have a bigger effect on pay across the local economy.
Whether a minimum wage is "high" or "low" cannot be read from the hourly figure alone. Put it next to rent and typical pay, and the picture flips: Tokyo’s minimum wage is the highest but living on it is hardest, while in the regions the minimum wage is lower but closer to what most people earn. When choosing where to work, compare the hourly rate together with rent and take-home pay.
This article is for information only and does not recommend working or moving in any particular area. Minimum wage amounts and effective dates are from the labour ministry’s published materials as of October 2026. Annual and monthly pay figures, shares of rent and estimated pay, and the years to ¥1,500 are this article’s own estimates based on published statistics. Whether a particular wage meets the minimum wage should be checked with the prefectural labour bureau or a labour standards inspection office.
References
- [1]Ministry of Health, Labour and Welfare, list of regional minimum wages for FY2026 (new and previous amounts, increase, rate of increase and effective date), published on the ministry’s page listing regional minimum wages (Japanese). MHLW (PDF) / listing page ↩
- [2]Ministry of Health, Labour and Welfare, revisions of regional minimum wages from FY2002 to FY2026 (amount and effective date for each year, national weighted average) (Japanese). MHLW (Excel) ↩
- [3]Ministry of Health, Labour and Welfare, press release: revised regional minimum wages recommended in all prefectures, with the national weighted average up ¥56 to ¥1,177 (3 September 2026) (Japanese). MHLW ↩
- [4]Ministry of Health, Labour and Welfare, annex: status of FY2026 regional minimum wage recommendations (rank, guideline amount, difference from guideline, planned effective date) (Japanese). MHLW (PDF) ↩
- [5]Ministry of Health, Labour and Welfare, press release: guideline for revising regional minimum wages in FY2026, ¥54 for rank A and ¥56 for ranks B and C (28 July 2026), with the Central Minimum Wages Council’s report (Japanese). MHLW / press release (PDF) ↩
- [6]Central Minimum Wages Council, view of the public-interest members on the FY2026 guideline (28 July 2026, annex 1): consumer prices, the minimum wage relative to median and mean wages, OECD and EU directive reference values, and the government’s ¥1,500 target (Japanese). MHLW (PDF) ↩
- [7]Ministry of Health, Labour and Welfare, overview of the minimum wage system and the guideline system for revising regional minimum wages (reference 1 to the guideline report) (Japanese). MHLW (PDF) ↩
- [8]Ministry of Health, Labour and Welfare, national weighted average of regional minimum wages and rates of increase, FY2016–FY2025 (reference 3 to the guideline report) (Japanese). MHLW (PDF) ↩
- [9]Ministry of Health, Labour and Welfare, overview of the minimum wage system (who is covered, dispatched workers, which pay counts) (Japanese). MHLW ↩
- [10]Ministry of Health, Labour and Welfare, how to check whether pay meets the minimum wage (converting to an hourly amount, with worked examples) (Japanese). MHLW ↩
- [11]Ministry of Health, Labour and Welfare, 2025 Basic Survey on Wage Structure, prefectural reference table 1 for all 47 prefectures (published 24 March 2026). Estimated annual pay is calculated as in Average Salary by Prefecture in Japan: 2026 Ranking (Japanese). e-Stat ↩
- [12]Ministry of Internal Affairs and Communications, 2023 Housing and Land Survey, basic tabulation table 112-2 (monthly rent of private rental housing). Prefectural figures are the same as in Rent by Prefecture in Japan: 2026 Ranking (Japanese). e-Stat ↩

NEW NOVEL 2026/08/01
Clouded Glass
Polishing is not about force.
Volume two of The World Became Slightly Farther Away.Five stories that can also be read as a starting point.
View on Amazon
Jijoden.com
Your life is worth writing.
There is a truer self you can tell only to AI.Gather fragments of memory into a single story.
Take a LookRelated Articles
Average Age at First Marriage by Prefecture in Japan: The Latest Ranking, With Tokyo Highest and Shimane Lowest for Both Husbands and Wives
Using the latest final vital statistics from Japan’s health ministry (2025 data, published September 2026), this ranks all 47 prefectures by the average age at first marriage for husbands and wives. Nationally it is 31.0 for husbands and 29.7 for wives. Tokyo is highest and Shimane lowest for both. It also covers trends since 1950, how regional gaps have changed, the age gap between spouses and mothers’ age at first birth.
Price Levels by Prefecture in Japan: Latest Ranking as Tokyo Tops at 104.2, Gunma Is Cheapest at 96.2, and Hokkaido Leads Once Rent Is Excluded
Using the latest Regional Difference Index of Consumer Prices from the Statistics Bureau of Japan (2025 results, published September 2026), I ranked all 47 prefectures by price level. Tokyo is highest at 104.2 and Gunma lowest at 96.2, a gap of only 1.08 times. Excluding rent, Hokkaido comes first. Differences by category such as food, housing, utilities and education, changes from the previous year, and average pay and minimum wages adjusted for prices are covered too.
Life Expectancy by Prefecture in Japan: The Latest Ranking, With Shiga First for Men, Okayama First for Women and a 3.46-Year Gap to Aomori
Using the latest Prefectural Life Tables from Japan’s health ministry (2020 tables, published December 2022), this ranks all 47 prefectures by life expectancy for men and women. Shiga leads for men at 82.73 years, Okayama for women at 88.29, and Aomori is last for both. It also covers rankings by age, trends since 1965, healthy life expectancy and the latest national figures from the 2025 abridged life table.
Rent by Prefecture in Japan: 2026 Ranking as Tokyo’s ¥94,800 Is Twice Miyazaki’s, and 2.8 Times the Cheapest per Tatami
Using the latest Housing and Land Survey from Japan’s internal affairs ministry (2023), I ranked all 47 prefectures by monthly rent and rent per tatami for private rental housing. Tokyo is highest at ¥94,802 and Miyazaki lowest at ¥46,290. Tokyo’s 23 wards, change since 2018, the August 2026 Retail Price Survey and rent relative to pay are covered too.
Average Salary by Prefecture in Japan: 2026 Ranking as Tokyo Reaches an Estimated ¥6.78 Million, 1.69 Times Aomori
Using the latest Basic Survey on Wage Structure from Japan’s labour ministry (2025 survey, published March 2026), I estimated annual pay for all 47 prefectures with one formula: monthly pay × 12 + annual bonuses. Tokyo leads at ¥6.78 million, followed by Kanagawa and Aichi; Aomori is last at ¥4.01 million. Gender gaps, year-on-year change and regional prices are covered too.
From the Pocho Lab