
Table of Contents
Vacant homes usually make the news in Japan as "nine million nationwide, a record high". But how much does the picture differ between prefectures? Which prefectures have the most and fewest vacant homes, and are those homes the same kind? And what exactly does the statistic count as a vacant home?
This article uses the latest Housing and Land Survey from the Statistics Bureau of Japan, at the Ministry of Internal Affairs and Communications (as of 1 October 2023), to rank all 47 prefectures by vacant home rate and number of vacant homes[1][6]. It also ranks them by a second rate that excludes rental homes awaiting tenants, homes for sale and second homes such as holiday houses; on this measure, the order changes considerably. It then looks at how vacant homes are defined, trends since 1958, how regional gaps have shifted, what kinds of homes are vacant, and what the figures can and cannot tell us.
1. The short answer: Tokushima is highest at 21.3% and Saitama lowest at 9.3%
- Japan had 9,001,600 vacant homes, a vacancy rate of 13.8%, as of 1 October 2023. That is 513,000 more than in the previous survey in 2018: the number is a record, and the rate, up 0.2 points, is also the highest ever[1].
- By prefecture, the rate is highest in Tokushima (21.3%), Wakayama (21.2%) and Kagoshima (20.5%). With Yamanashi, Kochi and Nagano, six prefectures are above 20%. Saitama is lowest (9.3%), followed by Okinawa (9.4%) and Kanagawa (9.8%)[1].
- Tokyo has the most vacant homes: 896,500. It is 44th by rate but accounts for about one in ten vacant homes in Japan.
- Excluding homes for rent, homes for sale and second homes (such as holiday houses), Kagoshima ranks first (13.6%) and Tokyo 47th (2.6%). Shizuoka (15th to 37th), Tochigi (14th to 34th) and Yamanashi (4th to 18th) fall sharply, while Akita (22nd to 8th) and Tottori (24th to 11th) rise.
- Almost half of Japan's vacant homes (49.3%) are for rent. Vacant homes with no plan to rent, sell or use as a second home number 3,856,000 (42.8%), up 368,800 from 2018[1].
The source: the Housing and Land Survey
The Housing and Land Survey has been carried out by the Statistics Bureau every five years since 1948; 2023 was the 16th round. It is a sample survey covering about 3.4 million dwellings and households selected from across Japan[2]. Preliminary results for 2023 were published on 30 April 2024 and final results (the basic tabulation on dwellings and households) on 25 September 2024[1].
The figures in this article are final. Total dwellings and vacant homes by prefecture, and past trends, come from the time-series tables published on e-Stat, Japan's portal for official statistics[4][5][6].
2. What counts as a vacant home in the Housing and Land Survey
The term "vacant home" covers different things in different contexts. In this statistic, it does not mean only run-down detached houses.
A dwelling is a self-contained unit people could live in as it is
In this survey, a "dwelling" is a unit built for one household to live independently, such as a detached house or a flat in an apartment block. It must have at least one living room, its own kitchen, its own toilet and its own entrance. So-called derelict houses are not counted as dwellings, because no one could live in them as they are[3].
A dwelling counts as occupied, in principle, if someone has lived there for three months or more on the survey date, or is going to live there for three months or more[3].
A vacant home is a dwelling where no one usually lives, and there are four types
Dwellings where no one usually lives are "unoccupied dwellings". Excluding those used only temporarily (for example, only in the daytime, or by people taking turns to stay overnight) and those under construction leaves vacant homes. A building is counted as a vacant home once it can be locked up, even if the interior is unfinished[3].
Vacant homes are divided into four types.
| Type | Description | Number in Japan (share of vacant homes) |
|---|---|---|
| For rent | Homes, new or used, that are empty in order to be rented out | 4,435,800 (49.3%) |
| For sale | Homes, new or used, that are empty in order to be sold | 326,200 (3.6%) |
| Second homes | Holiday houses and homes used occasionally, for example to stay overnight after working late | 383,500 (4.3%) |
| Vacant homes other than those for rent, for sale or as second homes | Vacant homes that are none of the above, such as homes left empty for a long time because the household moved for work or is in hospital, or homes due to be demolished for rebuilding; includes homes whose type was hard to determine | 3,856,000 (42.8%) |
Definitions are from the survey's glossary[3] and numbers from the summary of results[1].
The fourth type was called "other dwellings" in surveys up to 2018. The 2023 survey renamed and reordered the categories, but the scope is unchanged[1]. Since the name is long, this article calls them "vacant homes excluding rental, sale and second homes".
Each empty flat in an apartment block counts as one
In apartment blocks and terraced houses, each dwelling inside the building is counted as one[1]. If two of ten flats in a block are empty, that is two vacant homes. The vacancy rate is the number of vacant homes divided by total dwellings (occupied plus unoccupied).
The legal definition of vacant houses is different
Japan's Act on Special Measures concerning Vacant Houses, the basis for municipalities' vacant house policies, defines "vacant houses, etc." as buildings, and their sites, that are normally not used for living or anything else, excluding those owned by national or local government[14]. Because it works building by building, an apartment block with one empty flat is not covered. The survey's count of vacant homes is a different number from the number of buildings covered by the act.
3. The full ranking: Shikoku, Wakayama, Kagoshima, Yamanashi and Nagano near the top; Greater Tokyo and Okinawa near the bottom
| Rank | Prefecture | Vacancy rate | Vacant homes | 2018 (rank) |
|---|---|---|---|---|
| – | Japan | 13.8% | 9,001,600 | 13.6% |
| 1 | Tokushima | 21.3% | 83,000 | 19.5% (4) |
| 2 | Wakayama | 21.2% | 105,300 | 20.3% (2) |
| 3 | Kagoshima | 20.5% | 184,200 | 19.0% (6) |
| 4 | Yamanashi | 20.4% | 87,200 | 21.3% (1) |
| 5 | Kochi | 20.3% | 78,700 | 19.1% (5) |
| 6 | Nagano | 20.1% | 208,500 | 19.6% (3) |
| 7 | Ehime | 19.8% | 145,600 | 18.2% (7) |
| 8 | Yamaguchi | 19.4% | 140,700 | 17.6% (9) |
| 9 | Oita | 19.1% | 115,500 | 16.8% (11) |
| 10 | Kagawa | 18.6% | 91,500 | 18.1% (8) |
| 11 | Iwate | 17.3% | 100,400 | 16.1% (14) |
| 11 | Nagasaki | 17.3% | 113,000 | 15.4% (18) |
| 13 | Shimane | 17.0% | 54,600 | 15.4% (18) |
| 14 | Tochigi | 16.9% | 163,700 | 17.3% (10) |
| 15 | Aomori | 16.7% | 98,800 | 15.0% (24) |
| 15 | Shizuoka | 16.7% | 296,300 | 16.4% (13) |
| 15 | Gunma | 16.7% | 161,300 | 16.7% (12) |
| 18 | Okayama | 16.5% | 157,200 | 15.6% (15) |
| 19 | Mie | 16.3% | 142,700 | 15.2% (21) |
| 19 | Miyazaki | 16.3% | 90,700 | 15.4% (18) |
| 21 | Gifu | 16.1% | 148,400 | 15.6% (15) |
| 22 | Hiroshima | 15.8% | 231,400 | 15.1% (23) |
| 22 | Akita | 15.8% | 69,500 | 13.6% (33) |
| 24 | Tottori | 15.7% | 41,300 | 15.5% (17) |
| 25 | Hokkaido | 15.6% | 451,900 | 13.5% (34) |
| 25 | Ishikawa | 15.6% | 86,400 | 14.5% (27) |
| 25 | Fukui | 15.6% | 53,100 | 13.8% (31) |
| 28 | Niigata | 15.3% | 155,300 | 14.7% (26) |
| 29 | Fukushima | 15.2% | 131,000 | 14.3% (28) |
| 30 | Kumamoto | 14.9% | 127,100 | 13.8% (31) |
| 31 | Toyama | 14.7% | 69,700 | 13.3% (36) |
| 32 | Nara | 14.6% | 93,600 | 14.1% (30) |
| 33 | Saga | 14.5% | 53,300 | 14.3% (28) |
| 34 | Osaka | 14.2% | 701,900 | 15.2% (21) |
| 35 | Ibaraki | 14.1% | 196,200 | 14.8% (25) |
| 36 | Hyogo | 13.8% | 386,900 | 13.4% (35) |
| 37 | Yamagata | 13.5% | 61,700 | 12.1% (41) |
| 38 | Kyoto | 13.1% | 180,400 | 12.8% (38) |
| 39 | Miyagi | 12.4% | 140,300 | 12.0% (42) |
| 39 | Fukuoka | 12.4% | 335,300 | 12.7% (39) |
| 41 | Chiba | 12.3% | 394,100 | 12.6% (40) |
| 41 | Shiga | 12.3% | 81,600 | 13.0% (37) |
| 43 | Aichi | 11.8% | 433,000 | 11.3% (43) |
| 44 | Tokyo | 10.9% | 896,500 | 10.6% (45) |
| 45 | Kanagawa | 9.8% | 467,100 | 10.8% (44) |
| 46 | Okinawa | 9.4% | 65,400 | 10.4% (46) |
| 47 | Saitama | 9.3% | 330,400 | 10.2% (47) |
Vacancy rates were calculated from total dwellings in time-series Table 3 and vacant homes in Table 4 (prefectural figures are rounded to the nearest 100) and rounded to one decimal place. They match the values in the appendix to the Statistics Bureau's summary of results for all 47 prefectures[5][6][1]. Ranks run from highest to lowest, with equal values sharing a rank. The 2018 values and ranks were calculated the same way.
Six prefectures are above 20%, and all four in Shikoku are in the top ten
Six prefectures have a vacancy rate of 20% or more: Tokushima, Wakayama, Kagoshima, Yamanashi, Kochi and Nagano. That works out at roughly one in five dwellings. All four prefectures in Shikoku (Tokushima, Kochi, Ehime and Kagawa) are in the top ten. Thirty-five prefectures are above the national rate of 13.8%.
Three are below 10%: Saitama, Okinawa and Kanagawa. Tokyo (10.9%), Aichi (11.8%), and Chiba and Shiga (12.3%) are also on the low side.
By region: 19.9% in Shikoku and 11.3% in Kanto
Adding up total dwellings and vacant homes in each region gives the following rates (calculated for this article, with Mie counted in Kinki).
- Shikoku: 19.9%
- Chugoku: 16.8%
- Hokkaido and Tohoku: 15.2%
- Chubu: 15.1%
- Kyushu and Okinawa: 14.8%
- Kinki: 14.4%
- Kanto: 11.3%
Differences within regions are large, though. In Kyushu and Okinawa, Kagoshima is at 20.5% while Okinawa is at 9.4% and Fukuoka at 12.4%.
By number, Tokyo has the most vacant homes
Ranked by number rather than rate, Tokyo has the most (896,500), followed by Osaka (701,900), Kanagawa (467,100), Hokkaido (451,900) and Aichi (433,000). These five account for 32.8% of all vacant homes in Japan. Tottori has the fewest, at 41,300. Big metropolitan areas have so many dwellings that even a low rate means a large number of vacant homes.
4. Excluding rental, sale and second homes: Kagoshima first, Tokyo last
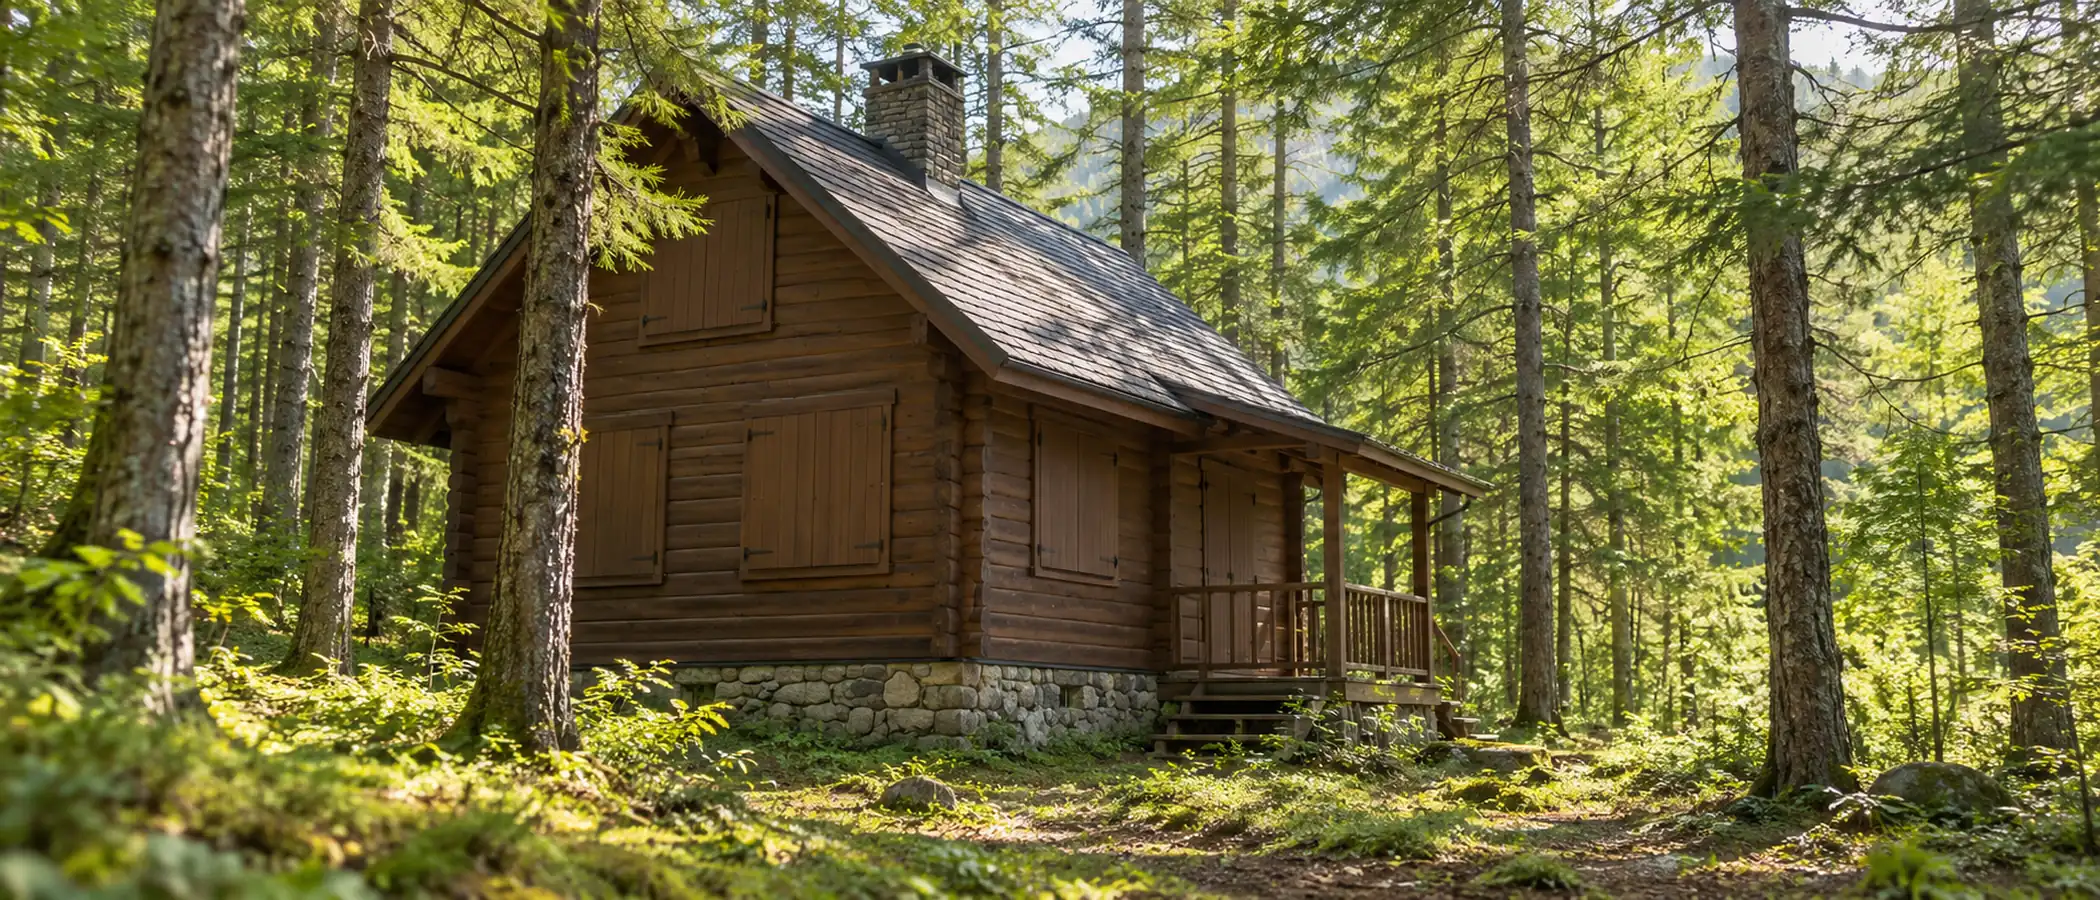
The vacancy rate includes rental homes awaiting tenants, homes for sale and second homes such as holiday houses. Nagano and Yamanashi have the highest share of second homes among all dwellings.
The vacancy rate so far includes rental homes looking for tenants, homes on the market and holiday houses. The table below ranks prefectures instead by the share of total dwellings made up of vacant homes other than those for rent, for sale or as second homes.
| Rank | Prefecture | Rate excl. rental, sale and second homes | Number | Rank by overall rate |
|---|---|---|---|---|
| – | Japan | 5.9% | 3,856,000 | – |
| 1 | Kagoshima | 13.6% | 122,200 | 3 |
| 2 | Kochi | 12.9% | 50,100 | 5 |
| 3 | Tokushima | 12.2% | 47,600 | 1 |
| 3 | Ehime | 12.2% | 90,100 | 7 |
| 5 | Wakayama | 12.1% | 59,800 | 2 |
| 6 | Shimane | 11.3% | 36,300 | 13 |
| 7 | Yamaguchi | 11.1% | 80,500 | 8 |
| 8 | Akita | 10.0% | 43,900 | 22 |
| 9 | Nagasaki | 9.9% | 64,900 | 11 |
| 9 | Miyazaki | 9.9% | 55,000 | 19 |
| 11 | Kagawa | 9.7% | 47,900 | 10 |
| 11 | Tottori | 9.7% | 25,400 | 24 |
| 13 | Oita | 9.6% | 58,000 | 9 |
| 14 | Mie | 9.5% | 83,100 | 19 |
| 15 | Iwate | 9.3% | 54,100 | 11 |
| 15 | Aomori | 9.3% | 55,000 | 15 |
| 17 | Nagano | 8.9% | 92,300 | 6 |
| 18 | Yamanashi | 8.7% | 37,200 | 4 |
| 19 | Okayama | 8.6% | 82,600 | 18 |
| 20 | Fukui | 8.5% | 28,900 | 25 |
| 21 | Toyama | 8.4% | 39,800 | 31 |
| 22 | Gifu | 8.1% | 74,400 | 21 |
| 23 | Yamagata | 7.9% | 35,900 | 37 |
| 24 | Hiroshima | 7.8% | 114,700 | 22 |
| 25 | Nara | 7.7% | 49,500 | 32 |
| 25 | Saga | 7.7% | 28,300 | 33 |
| 27 | Kumamoto | 7.6% | 65,000 | 30 |
| 27 | Niigata | 7.6% | 77,500 | 28 |
| 27 | Gunma | 7.6% | 73,100 | 15 |
| 30 | Ishikawa | 7.3% | 40,700 | 25 |
| 30 | Shiga | 7.3% | 48,500 | 41 |
| 30 | Fukushima | 7.3% | 62,600 | 29 |
| 33 | Ibaraki | 6.7% | 93,200 | 35 |
| 34 | Tochigi | 6.6% | 64,300 | 14 |
| 35 | Kyoto | 6.2% | 84,900 | 38 |
| 35 | Hyogo | 6.2% | 172,700 | 36 |
| 37 | Shizuoka | 5.9% | 104,800 | 15 |
| 38 | Hokkaido | 5.6% | 163,000 | 25 |
| 39 | Chiba | 5.0% | 158,500 | 41 |
| 40 | Fukuoka | 4.6% | 125,500 | 39 |
| 40 | Miyagi | 4.6% | 52,000 | 39 |
| 40 | Osaka | 4.6% | 226,900 | 34 |
| 43 | Aichi | 4.3% | 156,000 | 43 |
| 44 | Okinawa | 4.0% | 28,100 | 46 |
| 45 | Saitama | 3.8% | 135,800 | 47 |
| 46 | Kanagawa | 3.2% | 151,000 | 45 |
| 47 | Tokyo | 2.6% | 214,200 | 44 |
The calculation and sources are the same as for the table above, and the values match the published appendix for all 47 prefectures[5][6][1].
Much the same at the top, big reshuffles in the middle
The top of the list is Kagoshima (13.6%), Kochi (12.9%), Tokushima and Ehime (12.2%) and Wakayama (12.1%), broadly the same as the top by overall vacancy rate. Eight prefectures are at 10% or more, including Shimane, Yamaguchi and Akita. The rank correlation between the two rankings is 0.84 (calculated for this article), so overall they are similar.
Even so, some prefectures move a long way.
- Falling: Shizuoka (15th to 37th), Tochigi (14th to 34th), Hokkaido (25th to 38th), Yamanashi (4th to 18th), Gunma (15th to 27th), Nagano (6th to 17th)
- Rising: Akita (22nd to 8th), Tottori (24th to 11th), Yamagata (37th to 23rd), Shiga (41st to 30th), Miyazaki (19th to 9th), Toyama (31st to 21st)
Yamanashi, Nagano and Shizuoka have many second homes; Hokkaido has many rental vacancies
Most of the prefectures that fall have many vacant rental homes or second homes. Second homes make up 5.4% of all dwellings in Nagano (56,000), 4.0% in Yamanashi (17,100) and 2.2% in Shizuoka (38,500), far above the national 0.6%[6]. Second homes include holiday houses as well as homes used occasionally for overnight stays away from one's usual home[3].
Vacant rental homes make up the largest share of all dwellings in Hokkaido (9.0%), Osaka (8.8%), Shizuoka and Oita (8.1%), Tokushima (8.0%) and Tochigi (7.9%).
In Tokyo, seven in ten vacant homes are for rent
What vacant homes consist of differs clearly between big cities and elsewhere. In Tokyo, 70.2% of its 896,500 vacant homes are for rent, and vacant homes excluding rental, sale and second homes number 214,200, only 2.6% of total dwellings. The share for rent is also high in Osaka (62.1%), Kanagawa (59.7%) and Aichi (58.2%).
Conversely, vacant homes excluding rental, sale and second homes make up the largest share of all vacant homes in Shimane (66.5%), Kagoshima (66.3%), Kochi (63.7%) and Akita (63.2%).
Vacant rental homes include flats that are empty between one tenant and the next. The more rental housing a city has, the more vacancies of this kind it tends to have. Which rate you look at changes how the same prefecture appears.
5. The trend since 1958: from 2.0% to 13.8%, with dwellings outnumbering households since 1968
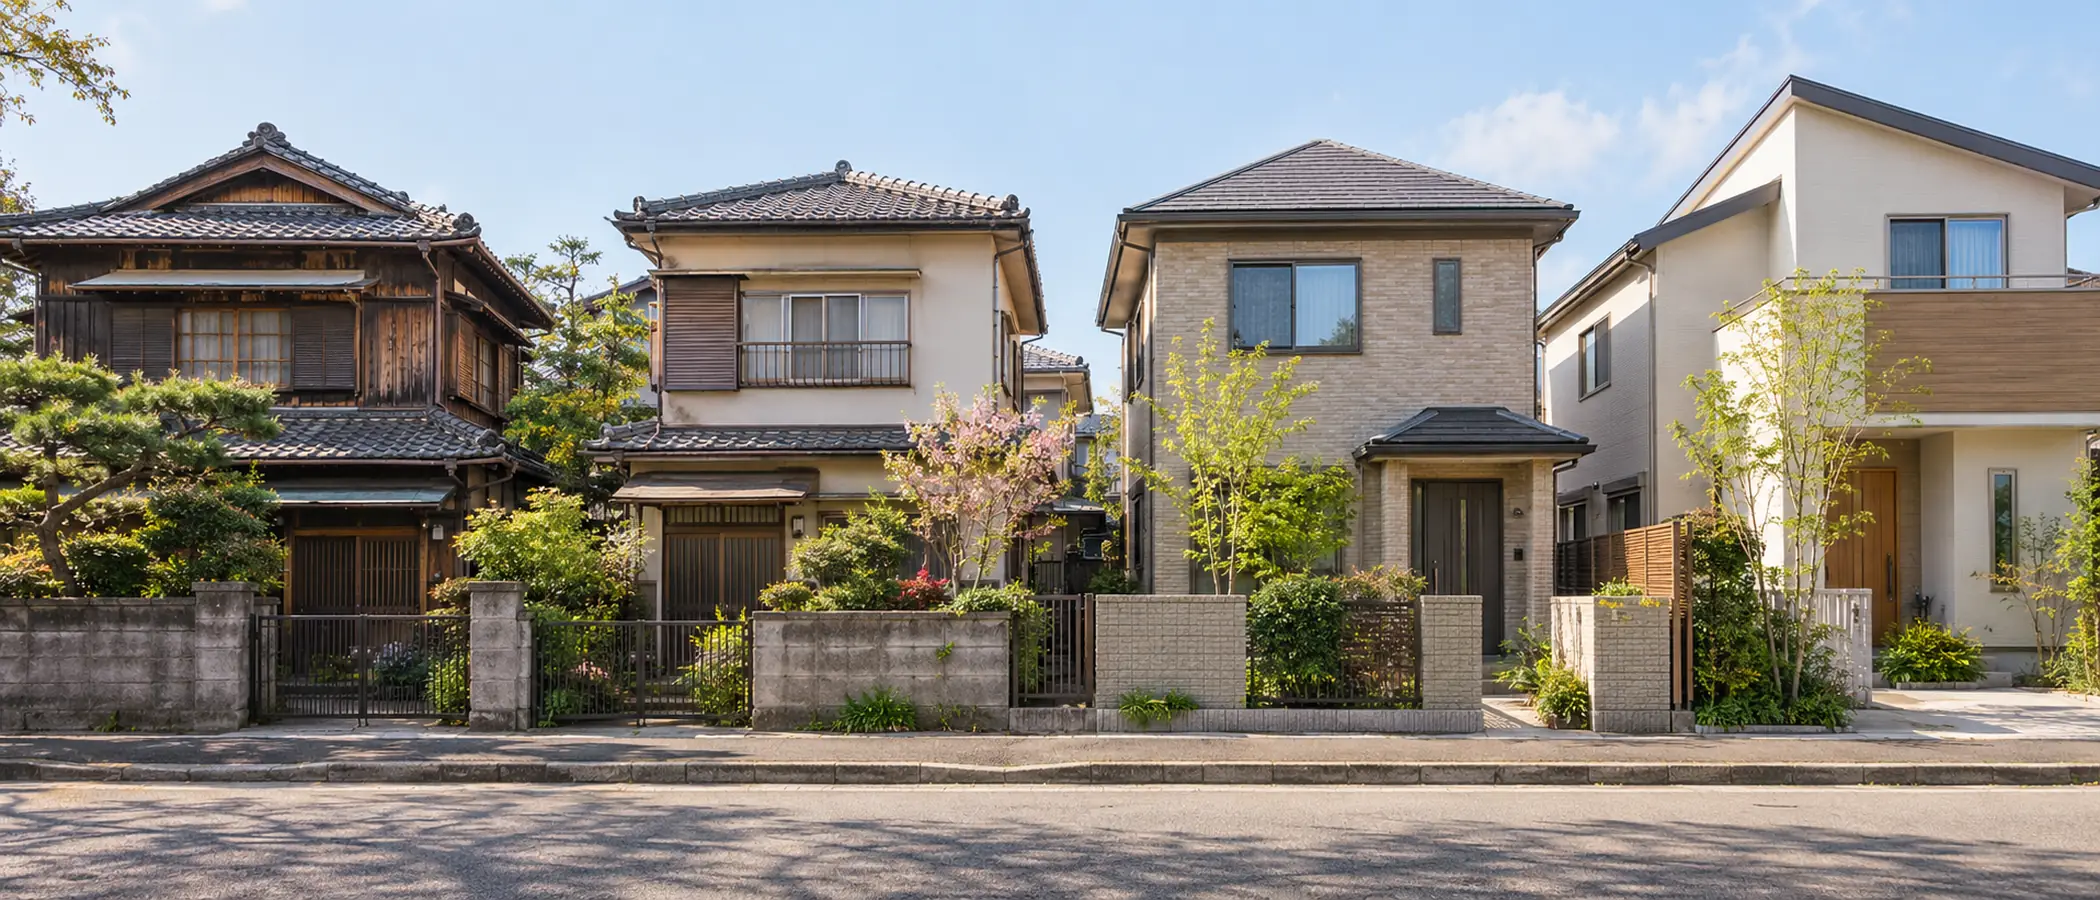
Japan's total dwellings rose from 17.93 million in 1958 to 65.05 million in 2023. Dwellings outnumbered households from 1968, and in 2023 there were 1.16 dwellings per household.
In 1958, the first year for which national vacant home figures are available (the 1953 survey covered only cities), there were 360,000 vacant homes and the vacancy rate was 2.0%[4].
| Year | Total dwellings | Vacant homes | Vacancy rate | Rate excl. rental, sale and second homes |
|---|---|---|---|---|
| 1958 | 17,934,000 | 360,000 | 2.0% | – |
| 1963 | 21,090,000 | 522,000 | 2.5% | – |
| 1968 | 25,591,200 | 1,034,200 | 4.0% | – |
| 1973 | 31,058,900 | 1,720,300 | 5.5% | – |
| 1978 | 35,450,500 | 2,679,200 | 7.6% | 2.8% |
| 1983 | 38,606,800 | 3,301,800 | 8.6% | 3.2% |
| 1988 | 42,007,300 | 3,940,400 | 9.4% | 3.1% |
| 1993 | 45,878,800 | 4,475,800 | 9.8% | 3.2% |
| 1998 | 50,246,000 | 5,764,100 | 11.5% | 3.6% |
| 2003 | 53,890,900 | 6,593,300 | 12.2% | 3.9% |
| 2008 | 57,586,000 | 7,567,900 | 13.1% | 4.7% |
| 2013 | 60,628,600 | 8,195,600 | 13.5% | 5.3% |
| 2018 | 62,407,400 | 8,488,600 | 13.6% | 5.6% |
| 2023 | 65,046,700 | 9,001,600 | 13.8% | 5.9% |
Source: time-series Table 1-1[4]. Figures for 1958 to 1968 exclude Okinawa. Vacant homes excluding rental, sale and second homes are shown from 1978, the first year in which the types can be compared[1]. Rates were calculated for this article from the counts and match the published figures.
The vacancy rate rose quickly in the 1960s and 1970s and passed 10% in 1998. Since 2003 it has risen more gently: 12.2%, 13.1%, 13.5%, 13.6% and 13.8%. The number of vacant homes, however, has never fallen, and it roughly doubled in the 30 years from 1993 to 2023[1].
The growth is in vacant homes excluding rental, sale and second homes
Looking at the breakdown, vacant homes excluding rental, sale and second homes rose from 976,600 in 1978 to 3,856,000 in 2023, roughly a fourfold increase. Their share of total dwellings went from 2.8% to 5.9%[4].
Of the 513,000 increase in vacant homes from 2018 to 2023, 368,800 were of this type. Vacant rental homes also rose, by 108,600, but their share of all vacant homes fell from 51.0% to 49.3%[1].
Dwellings outnumber households by about 8.83 million
Comparing dwellings and households in time-series Table 3, dwellings first outnumbered households nationally in 1968 (25,591,200 dwellings and 25,319,900 households). By 1973 dwellings outnumbered households in every prefecture[5].
In 2023 there were 65,046,700 dwellings and 56,215,300 households, or 1.16 dwellings per household. The difference, about 8.83 million, is close to the number of vacant homes (9,001,600). The number of vacant homes has grown during a long period in which dwellings have outnumbered households.
6. How regional gaps have changed: the gap has widened, and the rate rose in 36 prefectures from 2018
The prefectures at the top and bottom have changed from one survey to the next[5][6].
| Year | Japan | Highest | Lowest |
|---|---|---|---|
| 1958 | 2.0% | Wakayama 2.9% | Aomori, Yamagata 0.9% |
| 1973 | 5.5% | Chiba 7.1% | Yamagata 3.3% |
| 1988 | 9.4% | Kochi 13.4% | Yamagata 5.3% |
| 1998 | 11.5% | Nagano 15.3% | Yamagata 7.1% |
| 2008 | 13.1% | Yamanashi 20.3% | Okinawa 10.3% |
| 2018 | 13.6% | Yamanashi 21.3% | Saitama 10.2% |
| 2023 | 13.8% | Tokushima 21.3% | Saitama 9.3% |
Prefectural values were calculated for this article from the counts in Tables 3 and 4. The 1958 figures exclude Okinawa. Prefectural counts in early years are rounded more coarsely, so the rates are less precise.
In the 1970s, Chiba (1973) and Osaka (1978) were the highest in some years. Kochi was highest from 1983 to 1993, Nagano in 1998 and Yamanashi from 2003 to 2018; Tokushima took first place in 2023. Yamagata was the lowest in more years than any other prefecture (1968, 1973 and 1988 to 1998), and Saitama was lowest in 2018 and 2023.
The gap between high and low prefectures has widened
The gap between the highest and lowest prefectures grew from 8.2 points in 1998 to 12.0 points in 2023. The spread across all 47 prefectures (the standard deviation) also rose, from 1.62 in 1998 to 3.04 in 2023 (both calculated for this article). For vacant homes excluding rental, sale and second homes, the gap between highest and lowest widened from 3.8 points in 1983 to 11.0 points in 2023.
The five years since 2018
- The vacancy rate rose in 36 prefectures, fell in 10 and was unchanged in Gunma. The largest rises were in Oita (16.8% to 19.1%), Akita (13.6% to 15.8%), Hokkaido (13.5% to 15.6%), Nagasaki (15.4% to 17.3%), and Fukui and Yamaguchi (up 1.8 points). The largest falls were in Kanagawa, Osaka and Okinawa (down 1.0 point) and Saitama and Yamanashi (down 0.9 points).
- The number of vacant homes fell in six prefectures: Kanagawa (down 17,600), Saitama (down 15,800), Osaka (down 7,500), Yamanashi (down 2,800), Okinawa (down 2,500) and Ibaraki (down 1,000). Tokyo had the largest increase (up 86,600), followed by Hokkaido (up 72,100) and Aichi (up 39,200).
- The rate excluding rental, sale and second homes rose in 39 prefectures. The largest rises were in Ehime (10.2% to 12.2%), Tokushima (10.3% to 12.2%), and Aomori and Kagoshima (up 1.6 points). The number fell only in Fukuoka (down 500), was unchanged in Kochi and rose in the other 45.
Compared with 1998, 25 years earlier, the rate excluding rental, sale and second homes rose most in Kagoshima (6.9% to 13.6%), Ehime (5.7% to 12.2%), Tokushima (5.9% to 12.2%) and Wakayama (6.2% to 12.1%). It rose least in Okinawa (3.8% to 4.0%) and Tokyo (2.1% to 2.6%).
7. What the vacant homes are: 80% of vacant detached houses have no plan to be rented or sold, and 60% of household-owned vacant homes were inherited
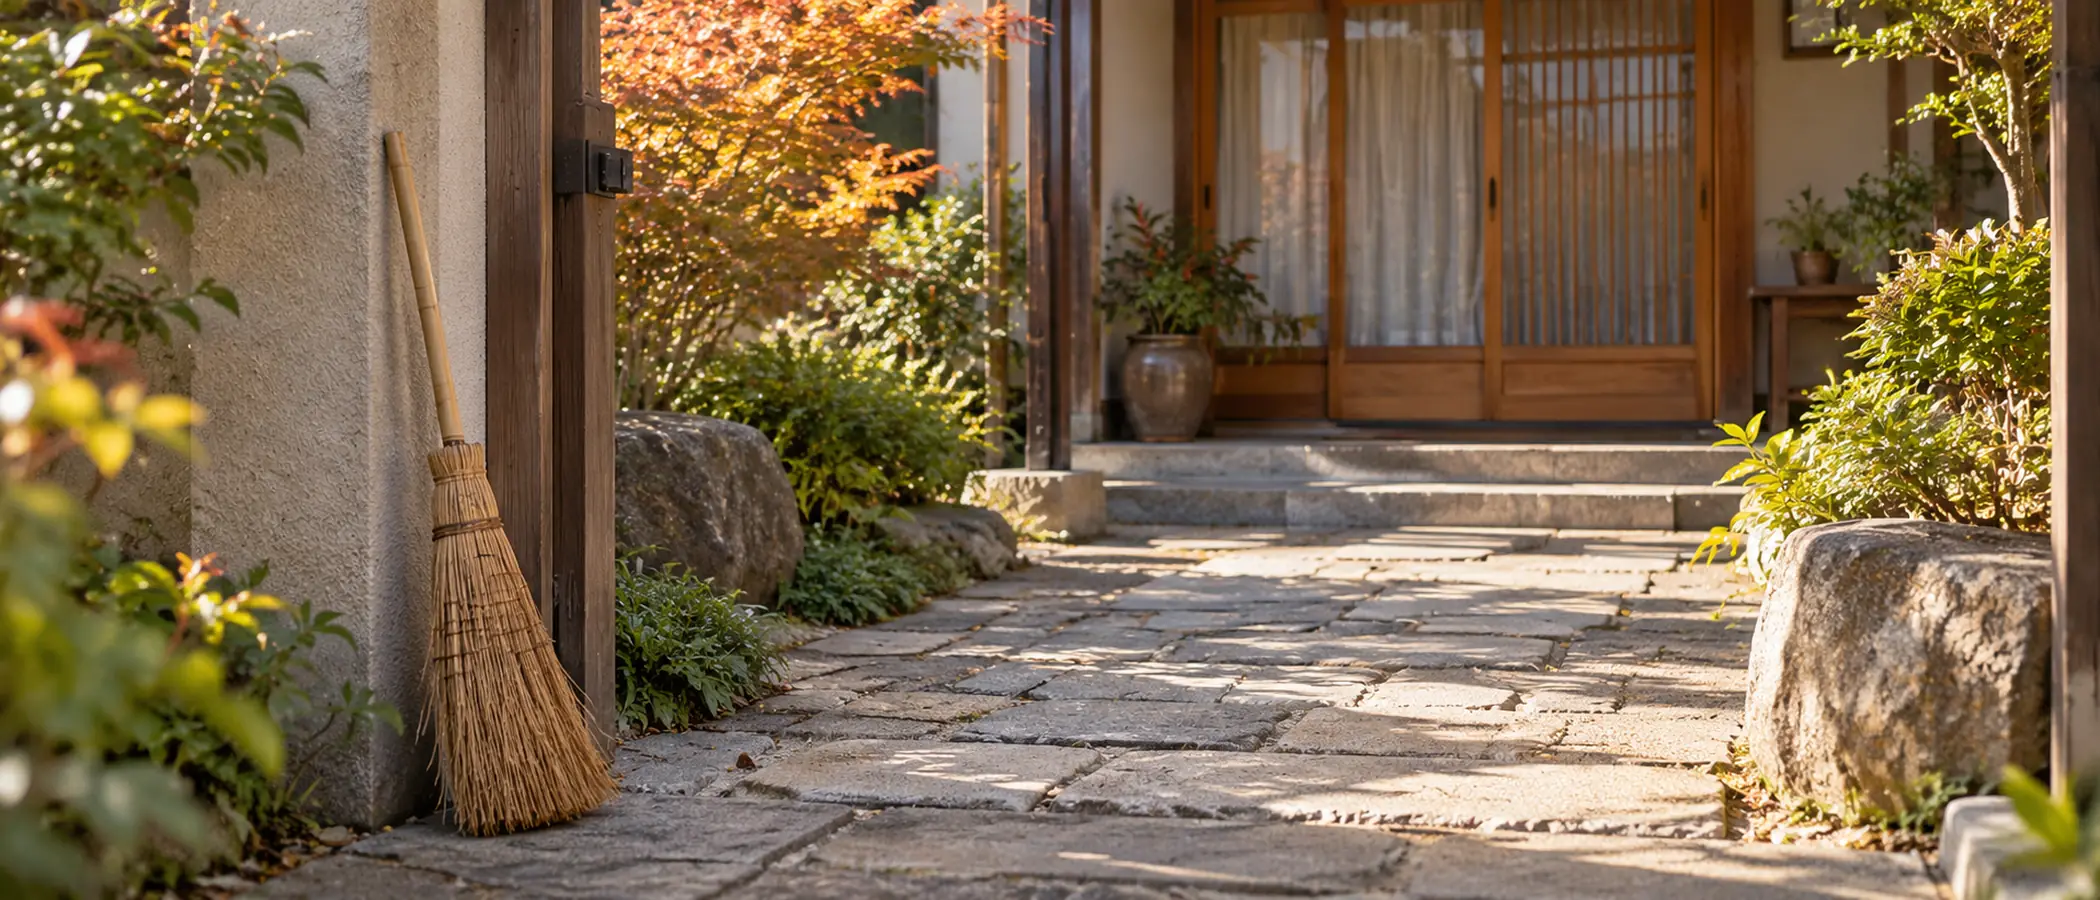
Of vacant homes owned by households, 61.6% were acquired by inheritance or gift (from the more detailed questionnaire). Some homes are looked after even though no one usually lives in them.
Detached houses and apartments have very different kinds of vacancy
By type of building, 3,523,000 of Japan's vacant homes are detached houses (39.1% of vacant homes) and 5,029,000 are flats in apartment blocks (55.9%). Of vacant detached houses, 80.9% (2,851,000) are vacant homes excluding rental, sale and second homes, while 78.5% of vacant flats (3,947,000) are for rent[1].
In a reference analysis, the Statistics Bureau estimated the type of ownership for the 4,794,000 vacant flats that are either for rent or vacant homes excluding rental, sale and second homes, using information such as that from other households in the same building. Private owners accounted for 3,709,000 (77.4%), and non-private owners such as public housing, public corporations and employer-provided housing for 915,000 (19.1%)[10]. These are estimates based on certain assumptions.
17.6% of vacant homes show some deterioration or damage
Survey enumerators record a dwelling as "deteriorated or damaged" when, seen from outside, its walls, pillars, roof or other parts have defects: for example, the outer wall has fallen away in places, there are cracks in walls or foundations, or some roof tiles are missing[3].
In 2023, 1,584,500 vacant homes were deteriorated or damaged: 17.6% of vacant homes and 2.4% of all dwellings[7]. The share of vacant homes was highest in Aomori (27.7%), Akita (27.2%), Tokushima (26.3%), Kochi (25.8%) and Okinawa (25.4%), and lowest in Tokyo (11.7%) (calculated for this article). Just over 80% of vacant homes show no deterioration visible from outside.
Vacant homes owned by households: 60% were inherited or received as gifts
The survey also asks about homes that households own besides the one they live in. Some 1,416,000 households, 2.5% of main households, own an unoccupied (vacant) home. By main use, 47.5% of these vacant homes are not for letting, sale or use as a second home[1].
The more detailed questionnaire B, sent to about 500,000 dwellings and households[2], counts 789,000 such "household-owned vacant homes" (not for letting, sale or as a second home) nationwide. Of these, 486,000, or 61.6%, were acquired by inheritance or gift, and 44.6% were built in 1970 or earlier[8][9]. The time since anyone last lived there was under five years for 25.9%, 20 years or more for 13.2%, and unknown for 21.2%[9]. Where a household owns several, up to three were counted, and the figures are estimates rounded to the nearest thousand.
8. Reading the numbers: what the vacancy rate can and cannot tell us
It is a sample survey, so small differences carry error
The Housing and Land Survey estimates the whole country from about 3.4 million dwellings and households. The Statistics Bureau gives a standard error rate of 0.35% for the national number of vacant homes and 0.36% for vacant homes excluding rental, sale and second homes[12]. The estimation method is set out in the bureau's description of its sampling and estimation methods[11].
At prefectural level, the smaller the estimate, the larger the error. For prefectures with around 50,000 vacant homes, the standard error rate is about 2%[13]. Indeed, vacancy rates in 19 prefectures changed by 0.1 to 0.2 points between the preliminary and final results[1]. Differences in rank between prefectures that are only 0.1 or 0.2 points apart mean little.
Whether a home is vacant is judged mainly from outside
Vacant homes are surveyed by enumerators mainly from the outside of the building[10]. The building questionnaire is completed by enumerators checking the exterior or asking households or building managers[1]. Homes whose type is hard to determine are counted as vacant homes excluding rental, sale and second homes[3], so this category may include some homes that are in fact intended to be rented out or sold.
A snapshot every five years, on 1 October
The figures describe the situation on 1 October 2023, and the next survey is due in 2028. Changes in between cannot be seen in these statistics.
The vacancy rate is not a verdict on a region
Because the vacancy rate is a share of total dwellings, it varies a great deal with the types of building, the amount of rental housing, the number of holiday homes and how many new homes are being built. A high rate does not necessarily mean a place is hard to live in, and a low rate does not necessarily mean housing is short. The figure is one piece of information for understanding housing in a region.
Our ranking of rents by prefecture uses the same Housing and Land Survey to look at differences in rent between prefectures.
This article introduces published statistics and does not recommend buying, selling or moving home. Figures are from the Statistics Bureau of Japan's 2023 Housing and Land Survey (final results published on 25 September 2024; e-Stat time-series and main tables released on 30 September 2025). Prefectural vacancy rates were calculated from the published counts and checked against the bureau's published values. Regional rates, the rank correlation, standard deviations, shares of deteriorated or damaged homes and changes since 2018 and 1998 were calculated for this article.
References
- [1]Statistics Bureau of Japan, 2023 Housing and Land Survey: summary of results of the basic tabulation on dwellings and households (final), published 25 September 2024; sections 2 (vacant homes) and 9 (ownership of homes other than the current residence), appendix (main indicators by prefecture), reference 1 (outline of the survey) and reference 2 (preliminary and final results) (Japanese). Statistics Bureau (PDF) ↩
- [2]Statistics Bureau of Japan, 2023 Housing and Land Survey: outline of the survey (purpose and history, coverage, sampling) (Japanese). Statistics Bureau ↩
- [3]Statistics Bureau of Japan, 2023 Housing and Land Survey: glossary (dwellings, unoccupied dwellings, types of vacant home, deterioration or damage, household-owned vacant homes) (Japanese). Statistics Bureau (PDF) ↩
- [4]Ministry of Internal Affairs and Communications, 2023 Housing and Land Survey, time-series Table 1-1: dwellings by occupancy status (9 groups) and occupied buildings other than dwellings, Japan (1948–2023), released on e-Stat on 30 September 2025 (Japanese and English). e-Stat (Excel) ↩
- [5]Ministry of Internal Affairs and Communications, 2023 Housing and Land Survey, time-series Table 3: dwellings and households, Japan, three major metropolitan areas, prefectures and major cities (1958–2023), released on e-Stat on 30 September 2025 (Japanese and English). e-Stat (Excel) ↩
- [6]Ministry of Internal Affairs and Communications, 2023 Housing and Land Survey, time-series Table 4: vacant dwellings by vacant status (4 groups) and type of building (4 groups), Japan, three major metropolitan areas, prefectures and major cities (1958–2023), released on e-Stat on 30 September 2025 (Japanese and English). e-Stat (Excel) ↩
- [7]Ministry of Internal Affairs and Communications, 2023 Housing and Land Survey, main Table 10: vacant dwellings by deterioration or damage (2 groups) and construction material (4 groups), Japan, prefectures and 21 major cities, released on e-Stat on 30 September 2025 (Japanese and English). e-Stat (Excel) ↩
- [8]Ministry of Internal Affairs and Communications, 2023 Housing and Land Survey, main Table 35: household-owned vacant dwellings by type of building, method of acquisition and year of construction (questionnaire B), Japan, released on e-Stat on 30 September 2025 (Japanese and English). e-Stat (Excel) ↩
- [9]Ministry of Internal Affairs and Communications, 2023 Housing and Land Survey, main Table 36: household-owned vacant dwellings by period without occupants, year of construction, type of building and method of acquisition (questionnaire B), Japan, released on e-Stat on 30 September 2025 (Japanese and English). e-Stat (Excel) ↩
- [10]Statistics Bureau of Japan, reference analysis of vacant flats in apartment blocks: estimates from the 2023 Housing and Land Survey (Japanese). Statistics Bureau (PDF) ↩
- [11]Statistics Bureau of Japan, sampling and estimation methods of the 2023 Housing and Land Survey (Japanese). Statistics Bureau (PDF) ↩
- [12]Statistics Bureau of Japan, 2023 Housing and Land Survey, Table 2: standard error rates for main items, Japan (vacant homes 0.35%; vacant homes excluding rental, sale and second homes 0.36%) (Japanese). Statistics Bureau (PDF) ↩
- [13]Statistics Bureau of Japan, 2023 Housing and Land Survey, Table 1: standard error rates by size of estimate, for prefectures, municipalities, metropolitan areas, urban areas and distance zones (Japanese). Statistics Bureau (Excel) ↩
- [14]Act on Special Measures concerning the Promotion of Measures for Vacant Houses, etc. (Act No. 127 of 2014), Article 2 (definitions) (Japanese). e-Gov Laws and Regulations ↩
NEW NOVEL 2026/08/01
Clouded Glass
Polishing is not about force.
Volume two of The World Became Slightly Farther Away.Five stories that can also be read as a starting point.
View on Amazon
Jijoden.com
Your life is worth writing.
There is a truer self you can tell only to AI.Gather fragments of memory into a single story.
Take a LookRelated Articles
Total Fertility Rate by Prefecture in Japan: The Latest Ranking, With Okinawa Highest at 1.52, Tokyo Lowest at 0.96 and the Nation at a Record-Low 1.14
Using vital statistics from Japan’s health ministry, this ranks all 47 prefectures by total fertility rate. In 2025 the national rate was a record-low 1.14, with Okinawa highest (1.52) and Tokyo lowest (0.96). Prefectural 2025 figures are provisional, with final figures due in November 2026. It also covers changes from the previous year, trends since 1947, the number of births, how to read Tokyo’s figure and what the numbers cannot show.
Average Age at First Marriage by Prefecture in Japan: The Latest Ranking, With Tokyo Highest and Shimane Lowest for Both Husbands and Wives
Using the latest final vital statistics from Japan’s health ministry (2025 data, published September 2026), this ranks all 47 prefectures by the average age at first marriage for husbands and wives. Nationally it is 31.0 for husbands and 29.7 for wives. Tokyo is highest and Shimane lowest for both. It also covers trends since 1950, how regional gaps have changed, the age gap between spouses and mothers’ age at first birth.
Price Levels by Prefecture in Japan: Latest Ranking as Tokyo Tops at 104.2, Gunma Is Cheapest at 96.2, and Hokkaido Leads Once Rent Is Excluded
Using the latest Regional Difference Index of Consumer Prices from the Statistics Bureau of Japan (2025 results, published September 2026), I ranked all 47 prefectures by price level. Tokyo is highest at 104.2 and Gunma lowest at 96.2, a gap of only 1.08 times. Excluding rent, Hokkaido comes first. Differences by category such as food, housing, utilities and education, changes from the previous year, and average pay and minimum wages adjusted for prices are covered too.
Life Expectancy by Prefecture in Japan: The Latest Ranking, With Shiga First for Men, Okayama First for Women and a 3.46-Year Gap to Aomori
Using the latest Prefectural Life Tables from Japan’s health ministry (2020 tables, published December 2022), this ranks all 47 prefectures by life expectancy for men and women. Shiga leads for men at 82.73 years, Okayama for women at 88.29, and Aomori is last for both. It also covers rankings by age, trends since 1965, healthy life expectancy and the latest national figures from the 2025 abridged life table.
Rent by Prefecture in Japan: 2026 Ranking as Tokyo’s ¥94,800 Is Twice Miyazaki’s, and 2.8 Times the Cheapest per Tatami
Using the latest Housing and Land Survey from Japan’s internal affairs ministry (2023), I ranked all 47 prefectures by monthly rent and rent per tatami for private rental housing. Tokyo is highest at ¥94,802 and Miyazaki lowest at ¥46,290. Tokyo’s 23 wards, change since 2018, the August 2026 Retail Price Survey and rent relative to pay are covered too.
From the Pocho Lab
